Five Free Activities For Teaching Calculus
Calculus is the study of rates of change and of lengths, areas and volumes. Often, students have a hard time grasping the concepts of calculus, and even more, making connections among them. Dynamic visualization is a good tool for helping students to visualize and interact with the mathematics. Being able to manipulate and see changes in relations can help to solidify concepts and relationships among them. These 5 lessons are some of our favorites for helping students to make connections in calculus.
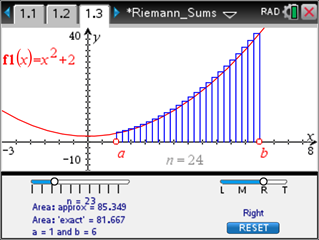
In this activity, your students can quickly learn that for a continuous nonnegative function f, there is one interpretation of the definite integral f(x)dx from a to b, the area of the region R, bounded above by the graph of y = f(x), below by the x-axis, and by the lines x = a and x = b. This is perhaps one of the quickest ways to visualize Riemann sums and students can look at the left hand, right hand, and midpoint Riemann sums easily for many different functions and intervals.
For more information, download the Teacher Notes (PDF).
You can view and download the full TI-Nspire activity on our website.
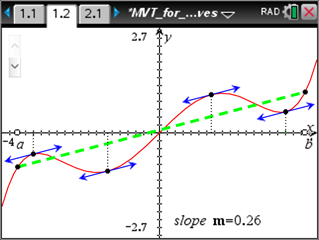
This lesson uses a graphical representation of the Mean Value Theorem (MVT) to demonstrate how the theorem relates information about the average rate of change of a function to an instantaneous rate of change.
For more information, download the Teacher Notes (PDF).
You can view and download the full TI-Nspire activity on our website.
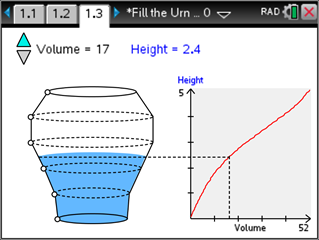
The Filling_the_Urn.tns TI-Nspire document provides for a graphical investigation of related rates. The physical context is the filling of an urn with liquid, depicted in a window on the left side of the illustration. The associated graph represents the height of liquid in the urn as a function of the amount of liquid in the urn. The shape of the urn determines the characteristics of this graph.
For more information, download the Teacher Notes (PDF).
You can view and download the full TI-Nspire activity on our website.
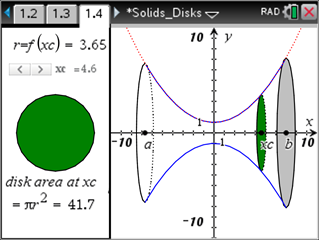
4. Visualizing Solids of Revolution – Disk Method
Students often have a difficult time visualizing the solids of revolution and how the volume and the integral are related. This interactive demonstration can help students make connections between the solid generated by revolving the function graph about the x-axis and disks centered on the x-axis, the radius of which correspond to the value of the function at that point.
For more information, download the Teacher Notes (PDF).
You can view and download the full TI-Nspire activity on our website.
The Box_Problem_Calculus.tns document takes a classic problem from calculus and uses the dynamic linking capabilities of TI-Nspire Technology to enact the problem in multiple representations: diagrammatic, graphic, numeric, geometric and symbolic. The problem is posed on the title screen shown at the right.
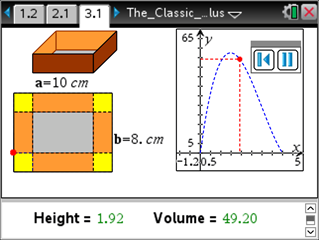
For more information, download the Teacher Notes (PDF).
You can view and download the full TI-Nspire activity on our website.
Tagcloud
Archive
- 2026
- 2025
- 2024
- 2023
- 2022
-
2021
- January (1)
- February (2)
- March (5)
-
April (6)
- Top Tips for Tackling the SAT® with the TI-84 Plus CE
- Monday Night Calculus With Steve Kokoska and Tom Dick
- Which TI Calculator for the SAT® and Why?
- Top Tips From a Math Teacher for Taking the Online AP® Exam
- Celebrate National Robotics Week With Supervised Teardowns
- AP® Statistics: 6 Math Functions You Must Know for the TI-84 Plus
- May (1)
- June (3)
- July (2)
- August (5)
- September (2)
-
October (4)
- Transformation Graphing — the Families of Functions Modular Video Series to the Rescue!
- Top 3 Halloween-Themed Classroom Activities
- In Honor of National Chemistry Week, 5 “Organic” Ways to Incorporate TI Technology Into Chemistry Class
- 5 Spook-tacular Ways to Bring the Halloween “Spirits” Into Your Classroom
- November (4)
- December (1)
- 2020
- 2019
-
2018
- January (1)
- February (5)
- March (4)
- April (5)
- May (4)
- June (4)
- July (4)
- August (4)
- September (5)
- October (8)
-
November (8)
- Testing Tips: Using Calculators on Class Assessments
- Girls in STEM: A Personal Perspective
- 5 Teachers You Should Be Following on Instagram Right Now
- Meet TI Teacher of the Month: Katie England
- End-of-Marking Period Feedback Is a Two-Way Street
- #NCTMregionals Kansas City 2018 Recap
- Slope: It Shouldn’t Just Be a Formula
- Hit a high note exploring the math behind music
- December (5)
- 2017
- 2016
- 2015