Science Activities for Heart Health Month
Science Activities for Heart Health Month
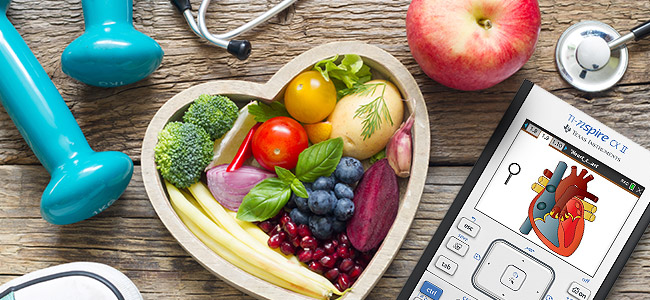
It’s American Heart Month and Valentine’s Day is just around the corner. What better time to explore cardiovascular health with your students? Here are several science lessons that will get your heart pumping!
The first activity uses the TI-84 Plus CE graphing calculator, while the others use the TI-Nspire™ CX or CX II graphing calculator. If you do not have emulator software for the TI-84 Plus CE or TI-Nspire CX graphing calculator, you can request a software license from your local Educational Technology Consultant to demonstrate these activities for use in your classroom.
Any additional equipment or materials that may be needed for data collection and analysis are highlighted as well.
The activities include:
- Effects on Heart Rate
- Respiratory Response – Heart and Lungs
- Blood Volume – River of Life
- Blood Pressure
Let’s get started!


Effects on Heart Rate
Here are three activities to choose from related to heart rate. The first two use a heart rate monitor by Vernier Science Education® with either a TI-84 Plus CE or TI-Nspire CX graphing calculator. The third is a simulation developed with NASA where probeware is not needed.
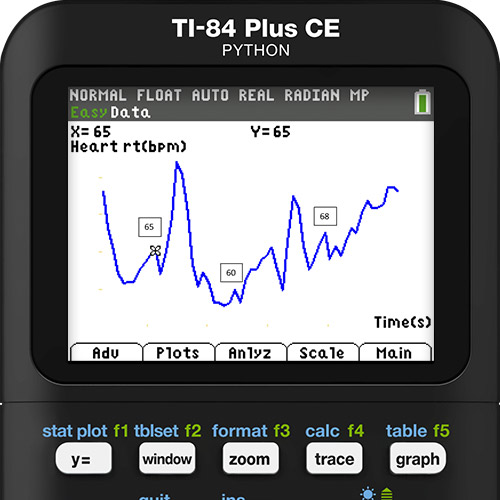
Heart Rate and Body Position
In the “Heart Rate and Body Position” lesson, developed in partnership with Vernier, students use a monitor to measure their heart rate while sitting, lying down and standing. Then they analyze the data they’ve collected to determine how body position affects heart rate. Students can design experiments to reduce their heart rate, such as listening to music or meditating.
Subject: Life Science, Biology
Duration: 60 minutes
Equipment needed:
- TI 84 Plus CE graphing calculator
- Vernier Exercise Heart Rate Monitor
- Vernier EasyLink® interface
- Saline solution in a dropper bottle
- Timer
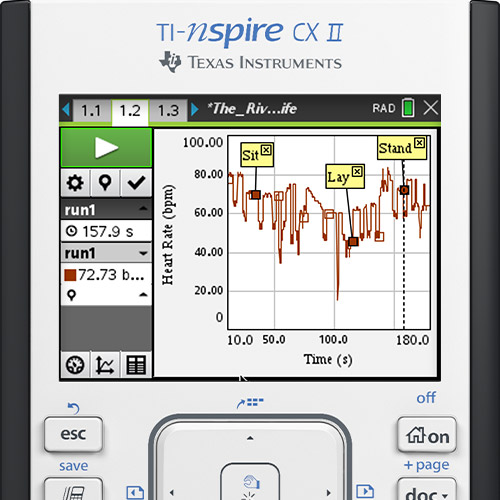
Heart Rate and Physical Fitness
The “Heart Rate and Physical Fitness” lesson is similar to the body position activity, but uses TI-Nspire™ technology with the Vernier heart rate monitor. In addition to exploring how body position and exercise affect heart rate, students correlate the fitness level of individuals with daily habits such as exercise, drinking coffee or smoking. They can investigate factors that alter heart rate by looking at different types of exercise as well.
Subject: Biology
Duration: 50 minutes
Equipment needed:
- TI-Nspire™ CX/CX II graphing calculator
- Vernier Hand-Grip Heart Rate Monitor or Vernier Exercise Heart Rate Monitor
- Vernier EasyLink® interface
- Stepping stool (18 inches high)
- Dropper bottle with saline solution (only for use with the Vernier Exercise Heart Rate Monitor)
- Timer
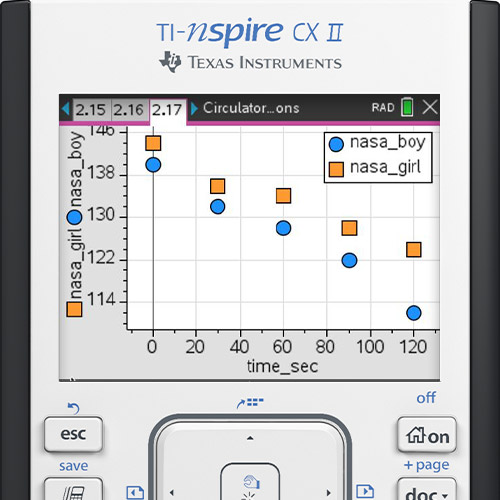
Physiology of the Circulatory System
In the “Physiology of the Circulatory System” lesson developed in conjunction with NASA, students collect data and use simulations to explore the circulatory system, blood pressure and heart rate under various conditions, including what happens with the circulatory system in space.
Subject: AP® Biology
Duration: 90 minutes
Equipment needed:
- TI-Nspire™ CX/CX II graphing calculator
- Timer
- Stairs
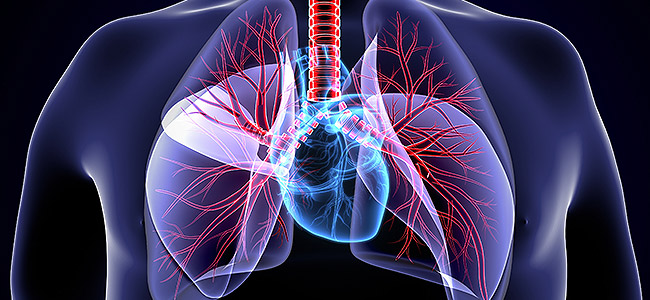
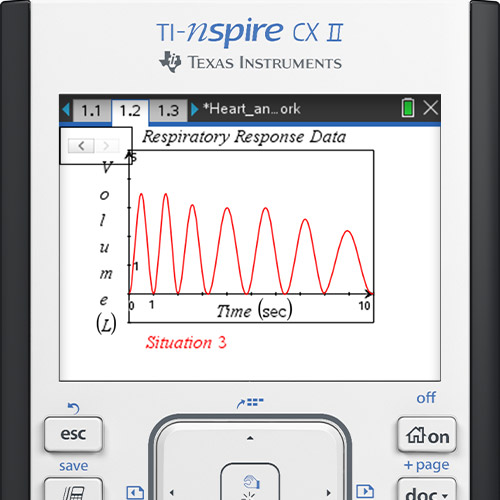
Respiratory Response - Heart and Lungs
Next, let’s take a look at a simulation that allows for student exposure to graphical analysis and productive discussions on how exercise affects respiratory response without the need of sensors. In “Heart and Lungs – Making Them Work,” students are tasked with:
- Analyzing graphs that represent how exercise changes vital signs of the cardiovascular and respiratory systems.
- Relating the shape of the graph to changing levels of CO2 that occur as a result of exercise.
- Making predictions on how daily exercise affects physical fitness.
Subject: Biology
Duration: 45 minutes
Equipment needed: TI-Nspire™ CX/CX II graphing calculator
For life science classes, you can use a similar activity, “Heart and Lungs – The Beat Goes On,” that is geared toward middle grades students. In this lesson, students also study the effect of exercise on heart rate, respiratory rate and airflow in and out of the lungs.
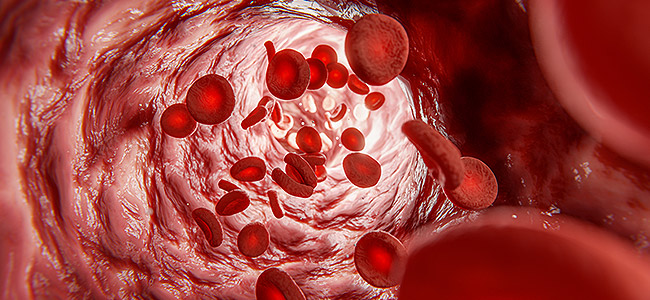
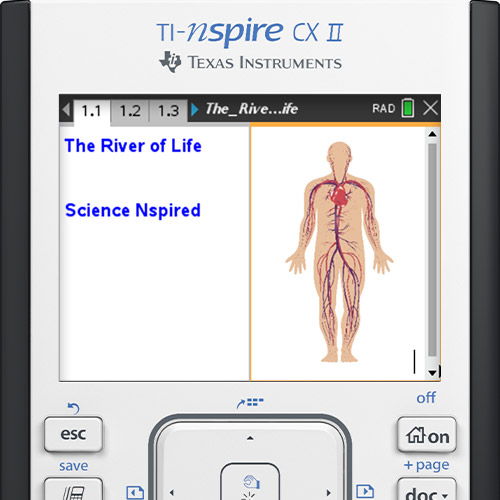
Blood Volume - River of Life
In the “River of Life” lesson, students determine how much blood is in their own bodies while connecting math and science. Students use tabular data to accurately generate a scatter plot and produce a linear regression model for human blood volume vs. body weight.
Subject area: Biology
Duration: 50 minutes
Equipment needed: TI-Nspire™ CX/CX II graphing calculator
The lesson poses such questions as:
- What is the relationship between body weight and blood volume?
- If you decided to donate blood at the blood bank, you would donate one pint. Using your own weight, calculate the percentage of your blood you would be donating.
- If 52% of your blood is water, what is the volume of water circulating in your blood vessels right now?
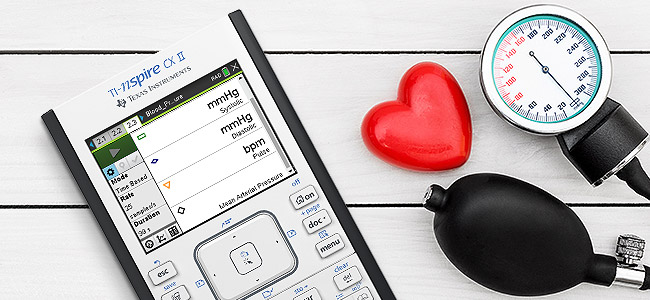
Blood Pressure
In the “Blood Pressure” lesson, students collect and assess vital health data, determine factors that influence blood pressure, connect those influences to physiological changes, and compare collected data to normal ranges for healthy blood pressure. The activity includes questions to assess students’ knowledge and facilitate discussion.
Subject: Biology
Duration: 45 minutes
Equipment needed:
- TI-Nspire™ CX/CX II graphing calculator
- Vernier blood pressure sensor
- Vernier EasyLink® interface
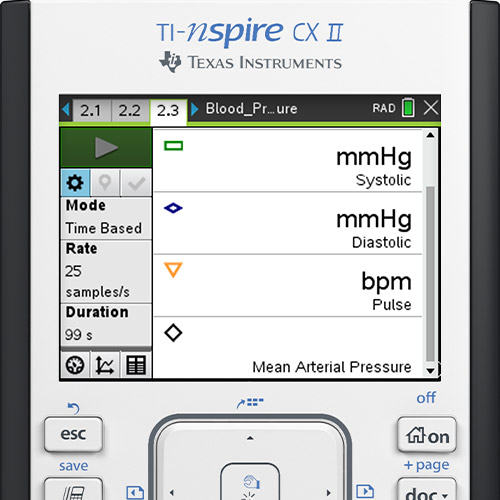
The ability to take and interpret blood pressure is a useful skill needed as a health professional. This activity provides the same real-world experience that health care providers would use to make decisions about patient care.
Jump start your heart with STEM activities
If you’re looking for a heart-themed activity that involves coding as you celebrate American Heart Month and Valentine’s Day with your students, check out Jessica Kohout’s blog post, The Heartbeat of STEM. She highlights “The Plumber: Modeling the Four-Chambered Heart” where students complete three different challenges to demonstrate the function of a heart using TI-Nspire™ CX technology and the TI-Innovator™ Hub.
Give one of these exciting activities a try and make your teaching heart happy. If you have questions or want to share a lesson you love, comment in our TI Teacher Community on Facebook.
If you need TI graphing calculators or other associated technology, our Educational Technology Consultants are happy to help you out. Give your local consultant a call or shoot them an email.
Happy heart day!
About the author: Erica Schiller is the Customer Marketing Manager at Texas Instruments Education Technology. In this role, she promotes using TI technology to support student success.
Vernier LabPro and Vernier EasyLink are registered trademarks of Vernier Science Education®.
AP® is a trademark registered by the College Board, which is not affiliated with, and does not endorse, TI products. Policies subject to change. Visit www.collegeboard.org.