Using the TI-Nspire™ CX II Series Creatively to Solve ACT Math Problems


|
About the author: Jeff McCalla, author of “TI-84 Plus CE Graphing Calculator for Dummies,” 2nd ed. (Wiley, 2022) and “TI-Nspire for Dummies,” 2nd ed. (Wiley, 2011), teaches math at St. Mary’s Episcopal School in Memphis, Tennessee. McCalla received the Presidential Award of Excellence in Mathematics and Science Teaching in 2009. |
The Enhanced ACT® allows a graphing calculator on every math question — whether the exam format is digital or paper. That’s not a footnote. It’s an opportunity and a competitive advantage.
The TI-Nspire™ CX II series opens up creative, efficient problem-solving approaches to ACT math questions, helping students save time, reduce errors, and uncover solutions that aren’t obvious at first glance.
This article highlights three strategies for using the TI-Nspire™ CX II graphing calculator with examples from recent ACT tests.

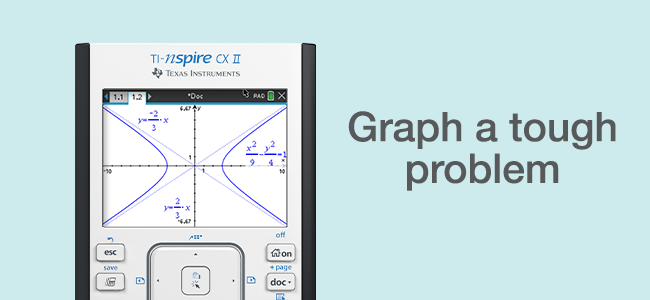
Calculator Strategy #1: Graph on a Tough Problem
At my school, I have worked with a lot of mathletes and help prepare them for math competitions. One strategy they employ is to graph on a tough problem. This strategy works beautifully on the ACT as well!
Here is a fairly difficult problem involving the asymptotes of hyperbolas.

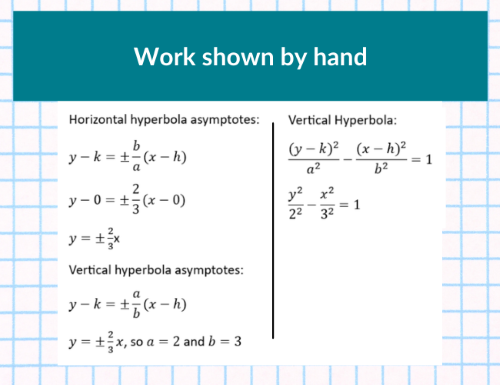
What percentage of students remember the formulas for hyperbolas? Hint: it’s not a big number! So, what do you do if you don’t know the formulas? Your graphing calculator has the ability to graph relations, which means you don’t have to solve the equation for y in order to graph it — that’s a game-changer on the ACT!
How to graph relations:
- On a Graphs page, delete the [=] and choose Option 6: Relations.
- Enter the equation and press [enter] to graph.
Analyzing the graph of a conic:
- Press [menu] > Analyze Graph > Analyze Conics > Asymptotes.
- Use your TouchPad to hover over the Tool Tip icon in the top left corner (if you don’t know how to use the tool).
- Use your TouchPad to click on the graph of the hyperbola to see the asymptotes.
Watch the video to see the steps.
Let’s try another tough problem.
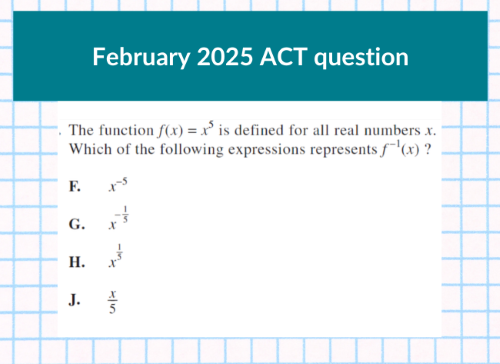
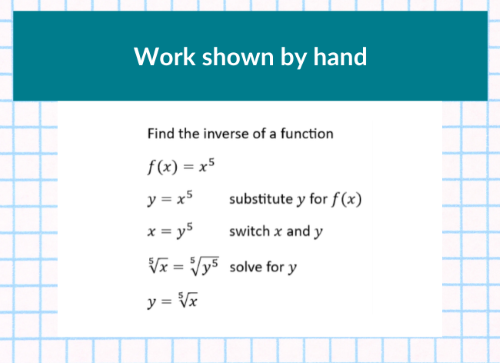
Most students know how to do the vertical line test to see if a relation is a function. However, finding the inverse is not an easy question. Solve it by graphing a relation and seeing which answer choice matches the inverse relation (x = y5).
Alternate way to graph a relation:
- Press [menu] > Graph Entry/Edit > Relations.
Watch the video to see the steps.
Domain and range is the bread and butter of Algebra 2. I want students to be able to find the domain algebraically, but I also think it’s good for students to find the domain from a graph. That’s exactly what we are going to do here, with the added twist of looking at the table as well.

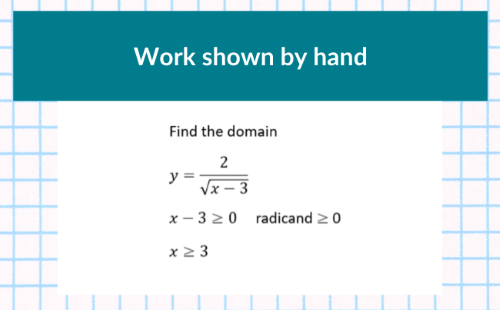
How to use Trace on a Graphs page:
- Press [menu] > Trace > Graphs Trace.
- Enter an x-value to evaluate and press [enter].
Accessing the table:
- Press[ctrl] [T] to access the table.
- Press [ctrl] [T] to remove the table.
Watch the video to see the steps.
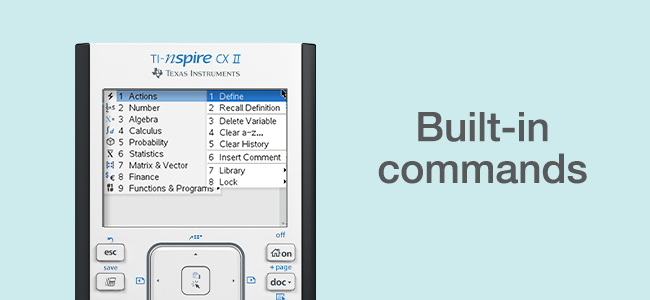
Calculator Strategy #2: Use the Built-in Commands
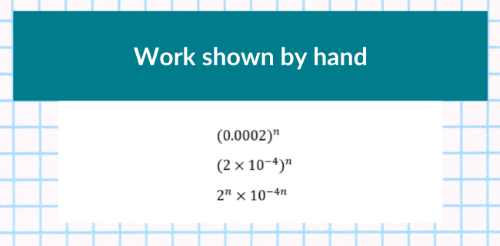
There are some ACT math problems that are very straightforward — all you have to do is enter the commands into your graphing calculator! Examples of this type of question include logarithms, matrices, absolute value, prime factor, scientific notation, exponents, and solve systems of linear equations.
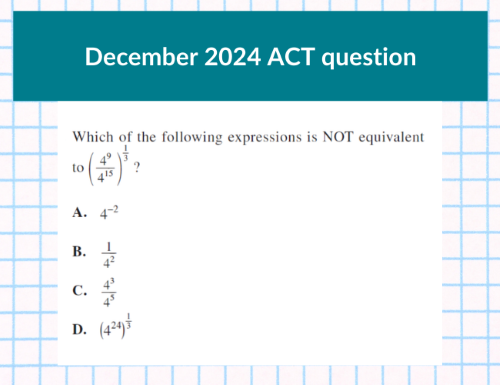
Here is an example of an exponent rule question.
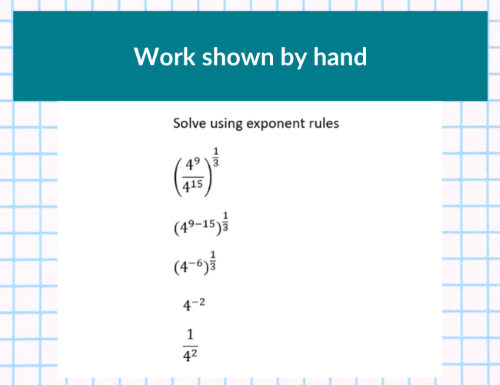
How to use the fraction template:
- Press [ctrl] [÷] to access the fraction template.
I hope you read the question carefully — choose the answer that is NOT equal!
Watch the video to see the steps.
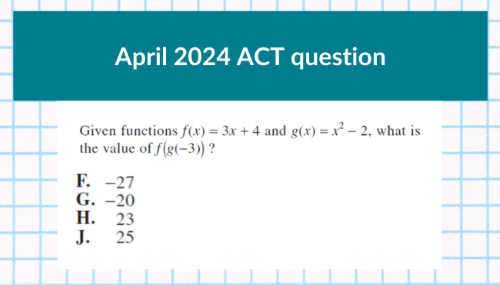
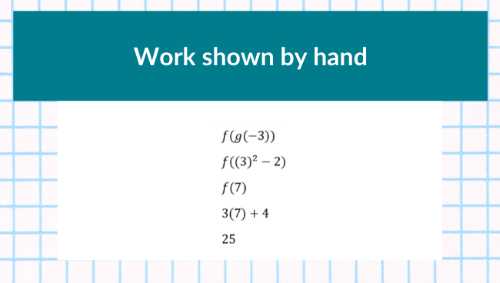
Function composition questions are common on the ACT. The very first command in the menu (Press [menu] > 1 > 1) is called the Define command. You can define a function f or g ... or whatever you would like to call them! Using this command protects students from common mistakes such as forgetting to substitute with parentheses.
Access the Define command:
- Press [menu] > Action > Define.
Watch the video to see the steps.
Equations can get much tougher than this one, so it’s nice to know you can solve a one-variable equation using your graphing calculator. Sometimes the choice boils down to which way is faster and more accurate. In many cases, that will be using your calculator.

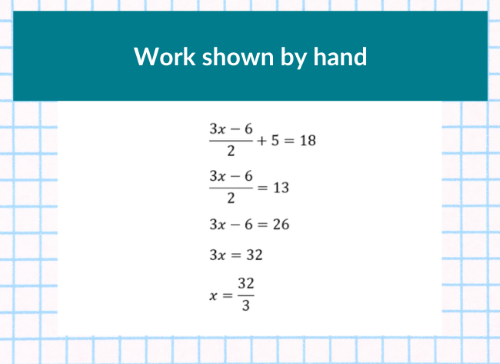
Access the Numeric Solver command:
- Press [menu] > Algebra > Numerical Solve.
- The syntax of the command is: nSolve(equation,variable).
Convert a decimal to a fraction:
- Press [menu] > Number > Approximate to fraction.
Watch the video to see the steps.
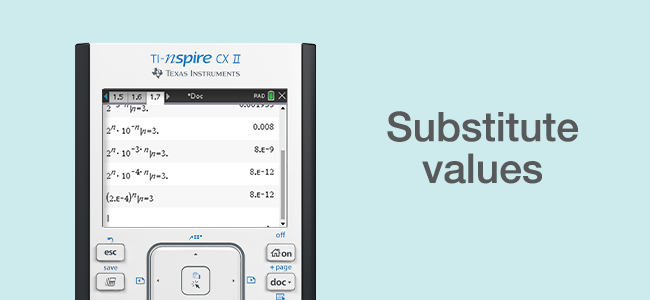
Calculator Strategy #3: Substitute Values
It’s easy to make a mistake substituting values into an expression or equation. Why not use your calculator to make sure that you substitute correctly? There are many ways, but I’ll show a few of my favorites.

What do you do when you get stuck solving a problem? The backup plan is always to try and plug something in. Sometimes that means plugging in the answers.
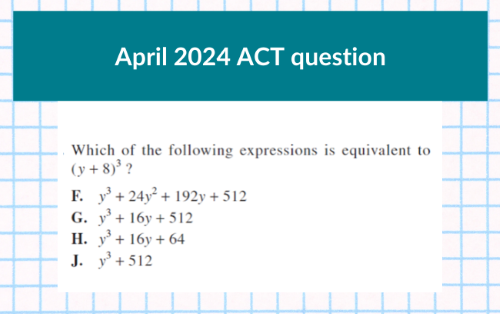
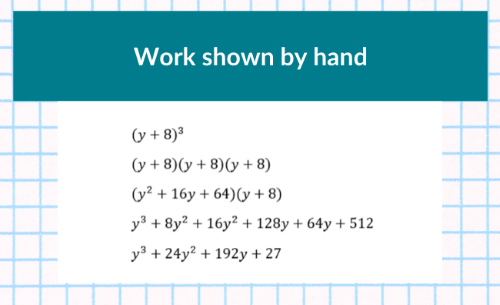
When you have equivalent expressions like this question, I recommend substituting a number in for x . Try making x equal to 3. Small, odd numbers work best.
How to use the “such that” operator (|):
- Press [ctrl] [=] and choose the vertical bar.
- Syntax is the (expression | variable=3).
How to turn a fraction into a decimal:
- Put a decimal in the problem. You could even say 𝑥 = 3 when using the “such that” operator (|).
Copy and paste to save time:
- Use the TouchPad arrows to arrow up until you highlight the expression you want to copy, then press [enter].
Watch the video to see the steps.
You can also use the “such that” operator (|) to find out if an equation is true for a given value. For the next problem, I am going to set the question equal to the answers until my graphing calculator says the equation is true.
Watch the video to see the steps.
Pretty neat, huh? Spend time getting to know the TI-Nspire™ CX II graphing calculator and the various features students can use when it comes time to take the ACT math test. A little practice can go a very long way!
Additional Resources
If you are a teacher and are interested in learning more about both the TI-Nspire™ CX II graphing calculator and the ACT; exam, check out this T³™ workshop. You can explore samples of the activities and strategies from this workshop by watching the free webinar that I co-hosted with Tom Reardon.
Find additional ACT prep video resources on the ACT website and TI’s YouTube channel. Also, you can read more ACT-related blog posts on the TI website.