Fans Love These 5 Features of the TI-84 Plus CE Graphing Calculator
Math fans everywhere love the TI-84 family of graphing calculators! In fact, Texas Instruments is the number one graphing calculator recommended by math teachers.
But why is that? We asked our teacher community on Twitter, Facebook and Instagram to share their favorite features of the TI-84 Plus CE graphing calculator.
In general, teachers love the variety of built-in features that make graphing easy to do. Most importantly, they love the features that help students make deeper mathematical connections. (Deeper discussions = better understandings!)
We highlighted five of the most popular features teachers highlighted as their personal favorites. Did yours make the list? Maybe you will find something new!

1. Graphing connections
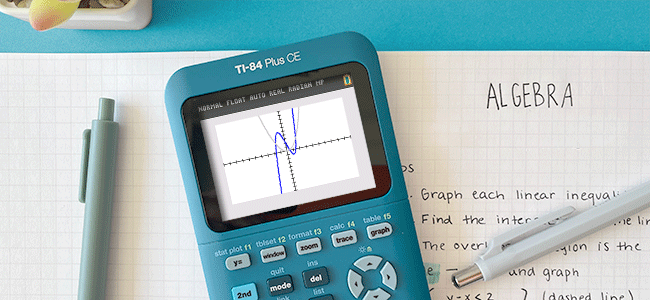
Our teacher community agrees, one of the greatest aspects of the TI-84 Plus CE is how it makes math jump to life in ways that make learning and understanding new concepts that much easier.
“I love that the calculator allows students to see functions and their features from a graphical perspective.” – Amy on Facebook
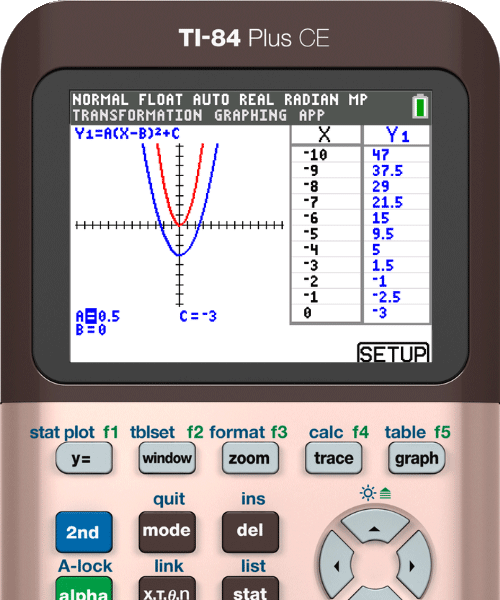
Transformation app
A core learning topic for math students is transformations, and the integrated Transformation Graphing App makes for a powerful learning and exploration tool. It’s a big help for students because they’re able to make connections and visualize transformations more clearly.
“[I love the] Transformation App … [it helps to] understand vertical shifts, horizontal shifts and dilations.” – Susan on Facebook
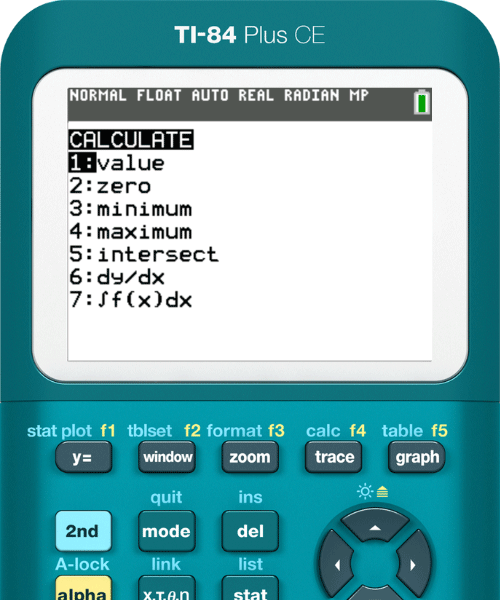
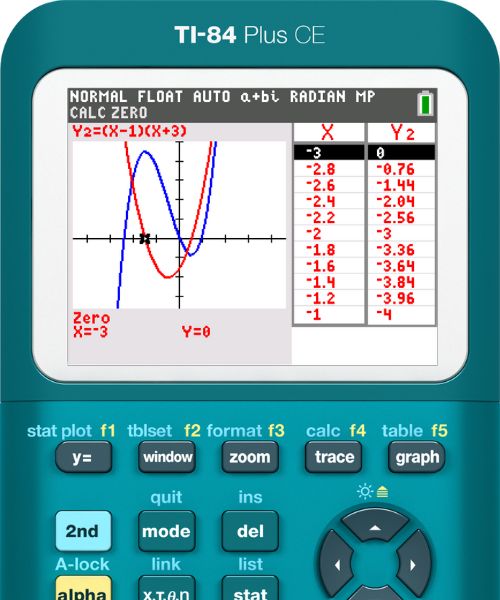
Trace/Calculate Menu
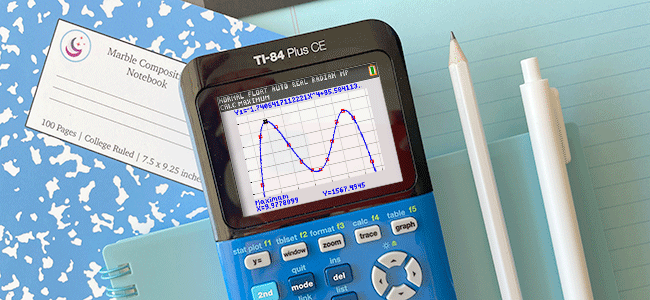
When needing to identify key points on a graph, the trace feature was another fan favorite.
“[My favorites are] … the tools to trace and calculate zeros, minima and maxima of a function.” – Kendra on Facebook
Table/graph view
Teachers also love viewing both a table and graph at the same time!
“I love that I can have a graph AND a table on the screen.” – Veronica on Facebook
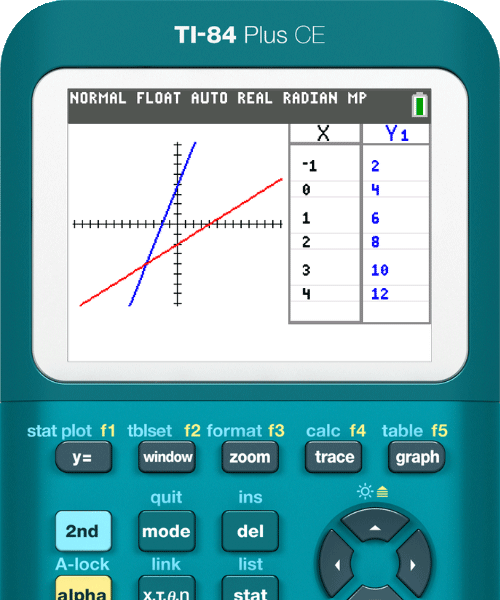
This quick view allows students to compare the data in the table to what their graph shows, enabling them to make their own connections. You can even combine this view with the calculate menu features.
“I love the ability to graph and see the table at the same time, then use that equation in the calculate menu to analyze the function with Calculus!” – Caitlin on Facebook
2. Colors everywhere!
A resounding feature loved by all is the ability to color-code functions, tables, graphs and transformations. It’s especially popular with teachers because of the quick visual connections and distinctions students can make at a glance.
“Color-coding functions, graphs, and tables is a game-changer!” – Amanda on Facebook
“The color graphing! It makes my data loving heart happy!” – Christine on Instagram
“My students love the colored graphs 🌈.” – Kitty on Instagram
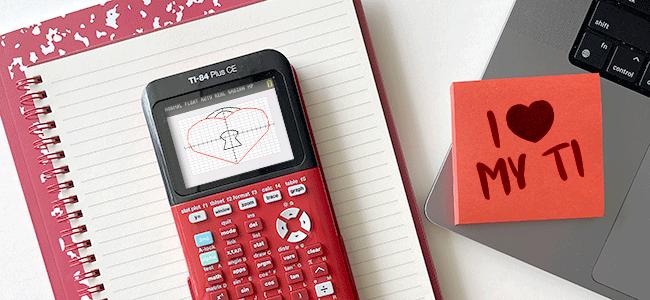
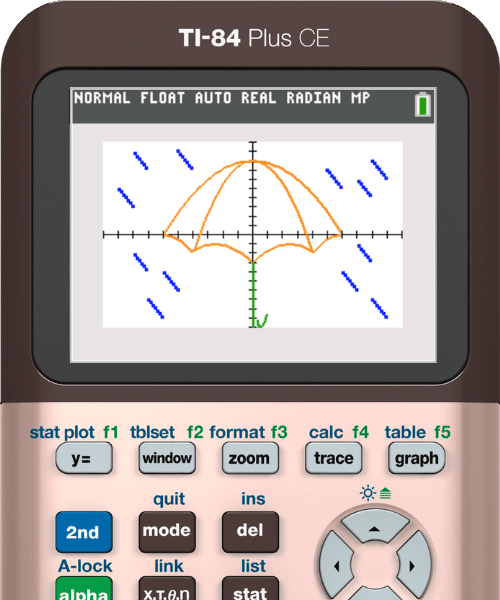
Color in transformations
One of the best examples highlighting the power of color-coding is with transformations.
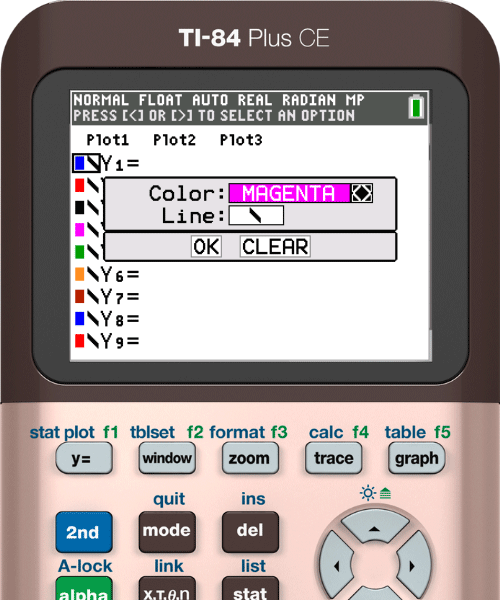
This will also change your colors on your tables!
For an extra splash of fun, you can even change the background color or add an image!
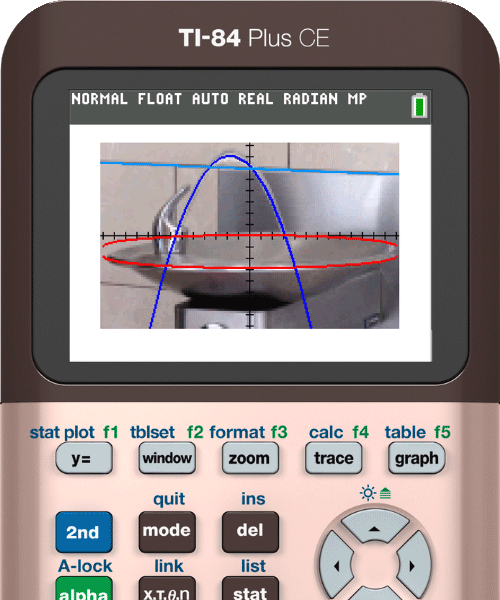
You can get pretty creative with colors and graphing! What could your students create?
3. Less struggle, more understanding
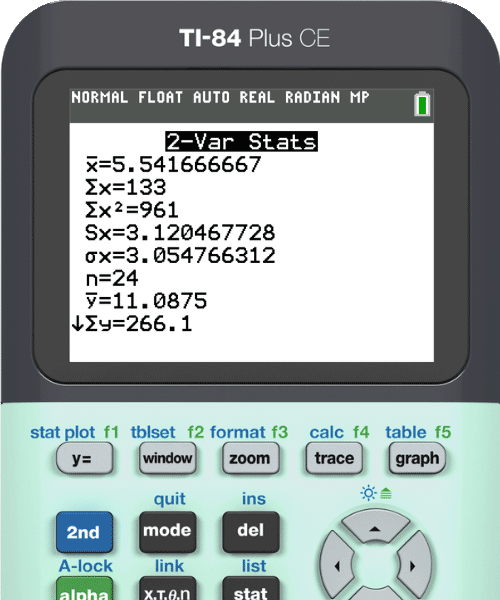
Another popular feature are the built-in statistics functions. Teachers appreciated being able to have in-depth conversations with students. Instead of getting stuck on “how,” teachers could lead deeper class discussions on the “why.”
“I love the stats function the best. To be able to calculate one and 2 var stats that quickly is game changer. Now I can spend more time on the ‘language’ part of stats. The wording of the problem itself.” – Math on Twitter
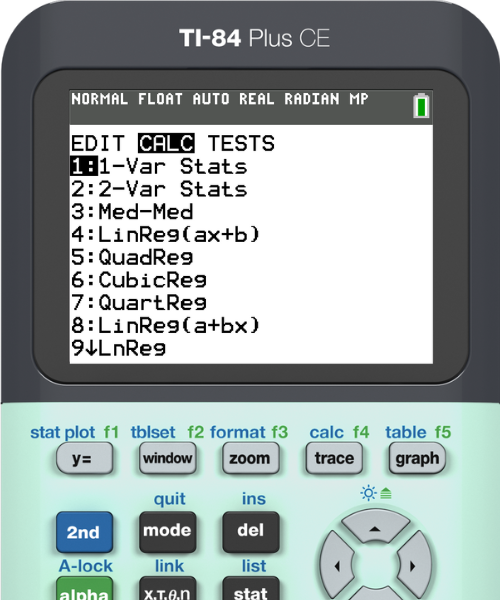
Teachers also mentioned how easy it is to do regressions.
“I love how easy it is to use a TI and how easy it is to do regression (especially compared to the one my state uses for state testing). – Ms. Ragghianti on Twitter
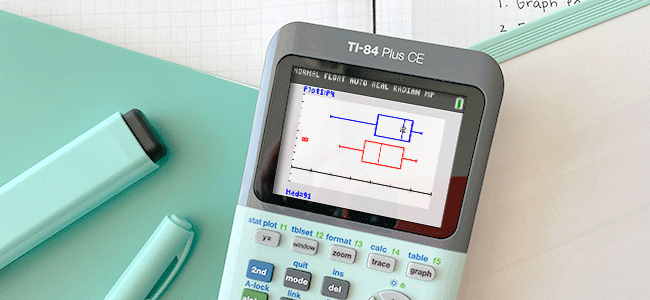
Let’s look at the data of height and arm spans put into two separate tables and then apply a linear regression.
A quick use of the stat menu allowed for quick graphing. Now students can analyze the data more easily.
4. MathPrint™ shortcuts
The MathPrint™ feature displays expressions, symbols and fractions just as they appear in your students’ textbooks. It includes a lot of shortcuts that help keep equations and answers looking more familiar and accessible.
Make sure MathPrint™ mode is turned on by pressing the “mode” key. It’s the top selection on the mode menu.
“I love the way that my students can now type in their answers in their calculator and it looks like it does on their papers thanks to [the MathPrint feature]!" – Julia on Instagram
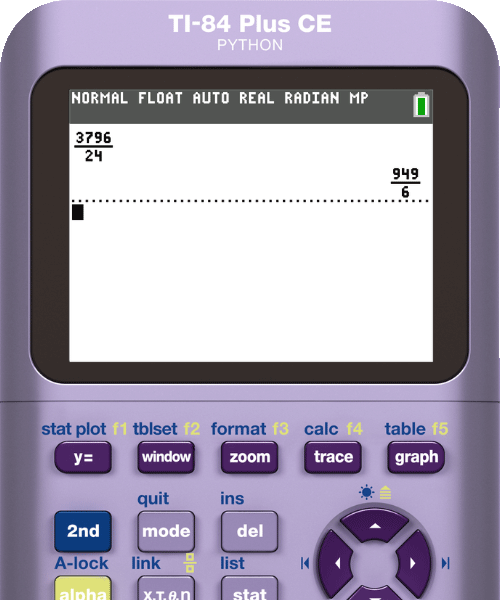
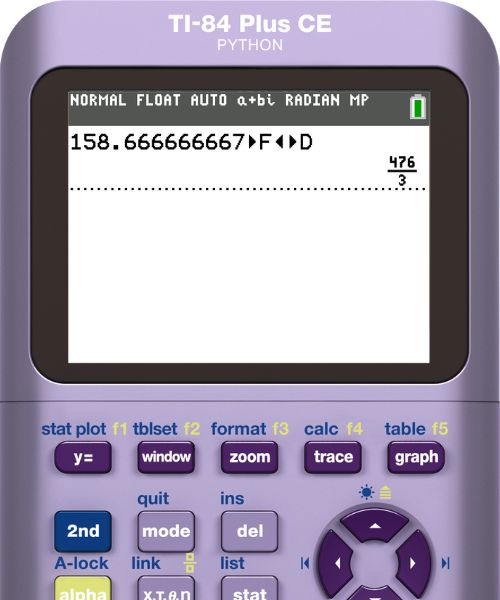
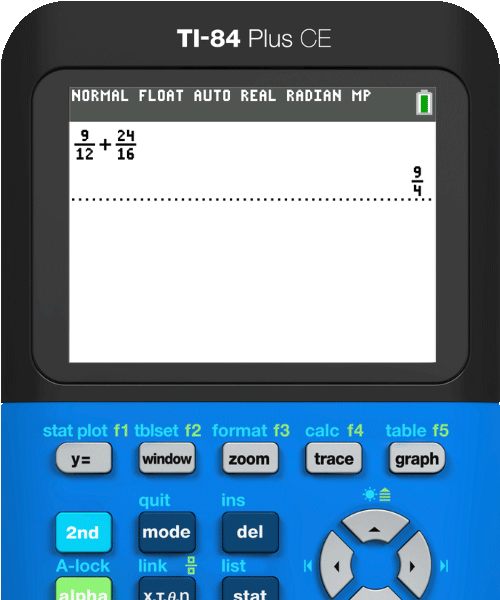
Fractions
It’s common for students to feel anxious when it comes to fractions, but the MathPrint™ template helps alleviate a lot of that anxiety.
"Kids have a fear of switching decimals to fractions and when I show them how to [do this on the] calculator, some thank me for getting rid of their anxiety." – Kevin on Facebook
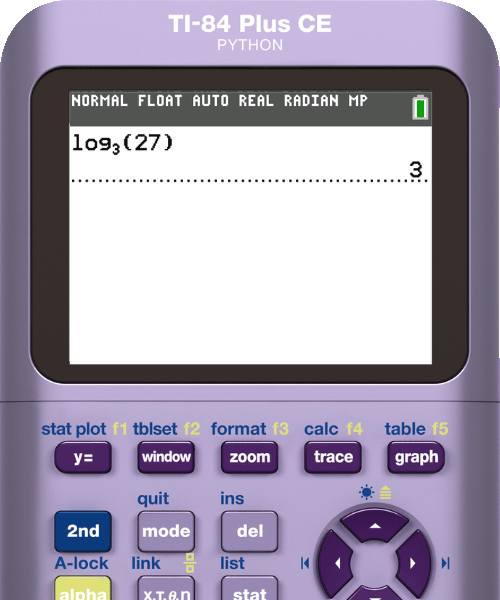
Logarithms
Calculating the logarithm of a specified base is tedious. Blow students’ minds with the log of a specified base template feature and get ready for their reactions!
“Showing my students the LOGBASE button after making them do change of base formula. They got so excited!” – Ms. Ragghianti on Instagram
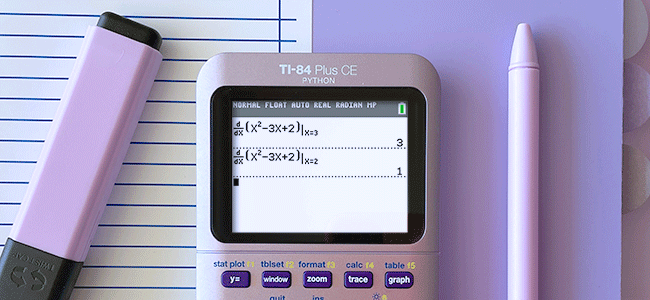
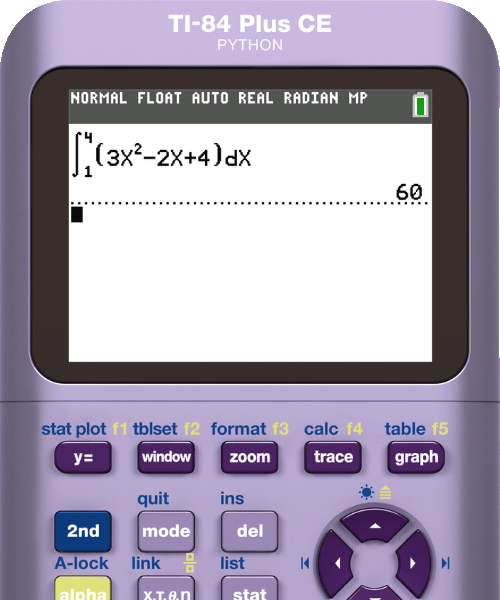
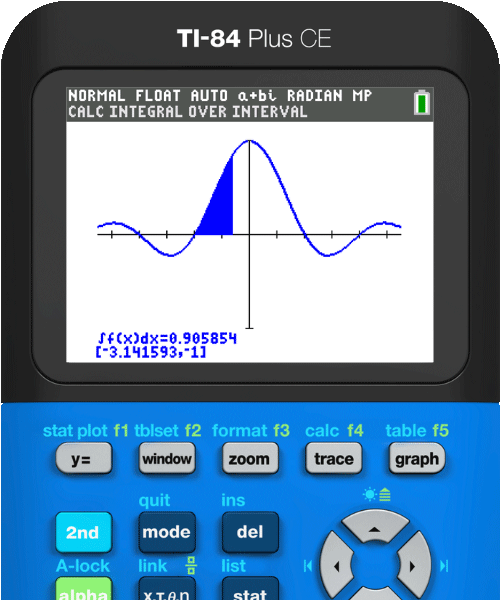
Definite integrals template
MathPrint™ templates even come in handy for calculus. The integrals template lets calculus students quickly enter definite integrals.
5. It keeps going and going!
From the simple to the complex, math teachers everywhere love how their TI-84 Plus CE helps students across all grade levels. They can apply many of the built-in features to whatever they’re teaching.
“I love that students of all levels of mathematics can use the features from Math 1 to Honors seniors classes.” – Stephanie from Facebook
“Love that this calculator can grow with students from middle school, through HS, and even into college.” – Pasquale from Twitter
What’s more, the TI-84 Plus CE is made to be durable and follow students from middle school all the way to college and beyond. How many devices do you own that last over a decade?
“I’ve been using a TI-84 for over 12 years! All of high school, university and now every day in my job!” – Giselle on Instagram
The ultimate math buddy
Those were only five of the most popular features our fans highlighted! You can check out all of their comments on Twitter, Facebook and Instagram. Did one of your favorite features make the list?
In the end, everyone agrees: The TI-84 Plus family of graphing calculators help make math exciting, easier to learn and to understand.
“I love that it provides opportunities for students to feel excited about math, do ‘math’ and actually feel as if math means something in the real-world.” – Andrew from Twitter
Find which calculator is right for you
Finding the right calculator model is an important decision for teachers, students and parents alike. (After all, they do tend to last forever!)
Where to buy your own
Another thing people loved? The variety of trendy colors! It’s fun to match your calculator to your own style and make it the ultimate math accessory.
Have a great 2023-24 school year!