Calculus + Graphing Calculator = More Teachable Moments
This is part 1 in a three-part series from the author on creating teachable moments.
It was almost 30 years ago, but it was one of those teaching moments indelibly etched in my memory. I had been assigned to teach introductory calculus, a course I had taught often, but on this day there was a new wrinkle — each of my students had a graphing calculator, and none of them had ever used one before. (We had secured a classroom set of the devices through a grant.)
To be honest, I really didn’t know what I was doing. I had no special book or other curriculum materials. So, I simply started the class with exactly the same example I had used in all my previous calculus courses — a look at the graph of a simple rational function, namely , having a removable discontinuity. Normally, I would have drawn the graph myself on the blackboard — a line with a prominent “hole” circled at coordinates (1,2). This time, I asked my students to graph it on their calculators.
Two students in the back of the room had been leaning back in their chairs, but the new gadgets had at least aroused some mild curiosity. I noticed one of them suddenly sitting up straight and leaning over to a neighbor pointing to the calculator screen. I was close enough to hear what was said: “My graph has a hole in it — does yours?” The hair stood up on the back of my neck, and I felt a shiver up my spine with those words: “my graph.” To me this was a profound shift. The student’s attention was not on a blackboard graph that the teacher had drawn, but on a graph that they had produced, exhibiting a feature that was surprising and worthy of explanation. Was this a machine bug or was there a mathematical explanation that would make sense of this unexpected phenomenon? I realized that I had a new and powerful hook to kickstart a classroom conversation about the mathematical language of limits, and the why behind the appearance of that hole.
This was the first of many aha teaching moments that I attribute to the introduction of graphing calculators, and I’d like to share some others with my fellow calculus teachers, both new and experienced.
A Menagerie of Discontinuities
One motivation for limits and their notations is the convenient language they provide for describing interesting graphical behavior. The graphing calculator literally puts that behavior on display, front and center. The example just described is not at all exotic, and is about as standard an example of a removable discontinuity as one could come up with. But, it took on new life when students saw it firsthand on their graphing calculators. Here are some other examples of discontinuities that I always ask students to graph themselves to motivate discussion.
I use a “Zoom Decimal” window to ensure that integer values for x line up exactly with a column of pixels.
I like this particular example because it provides a jump discontinuity without the need to make up a split formula function definition.
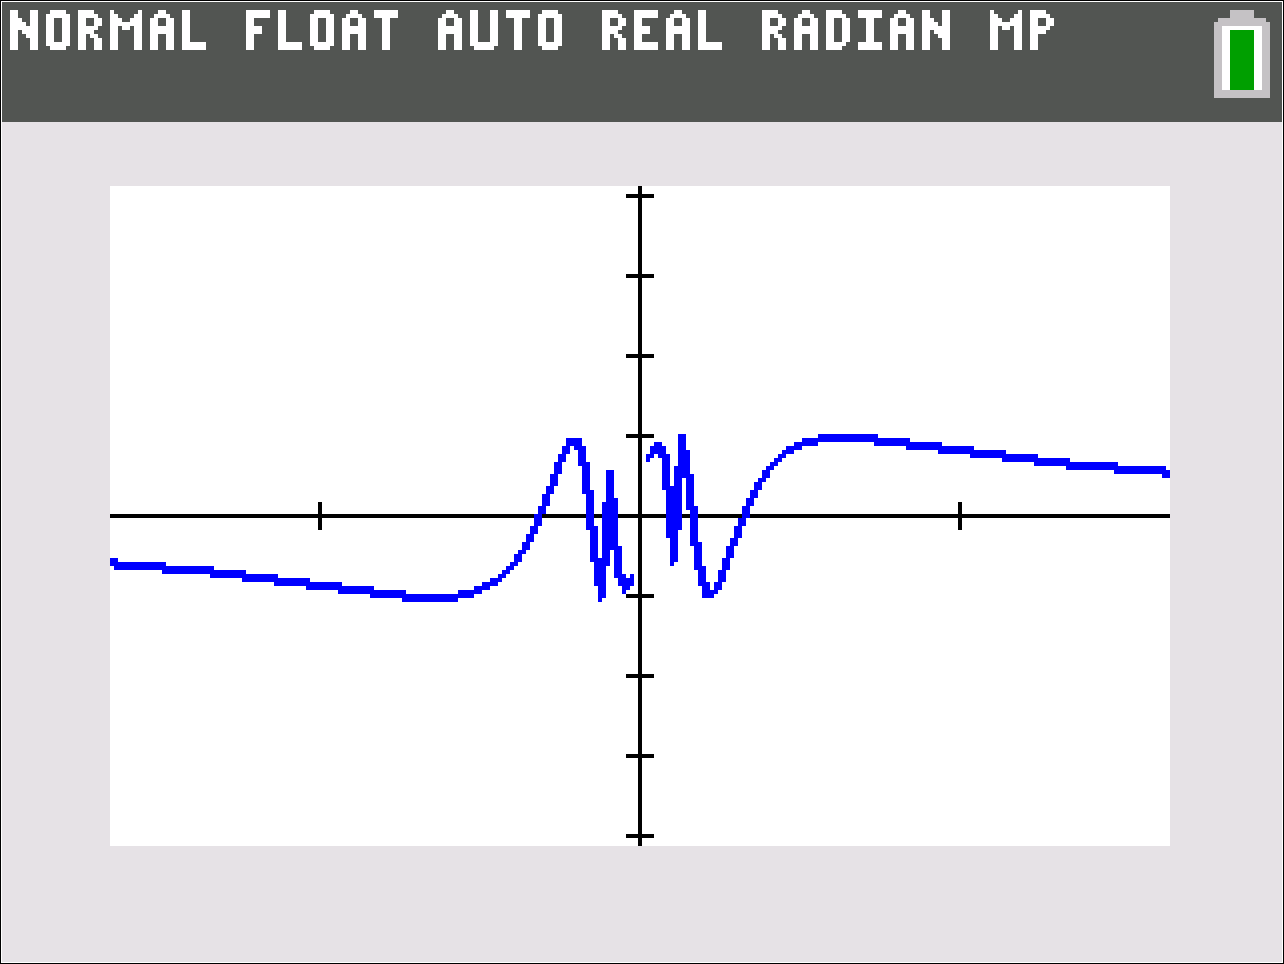
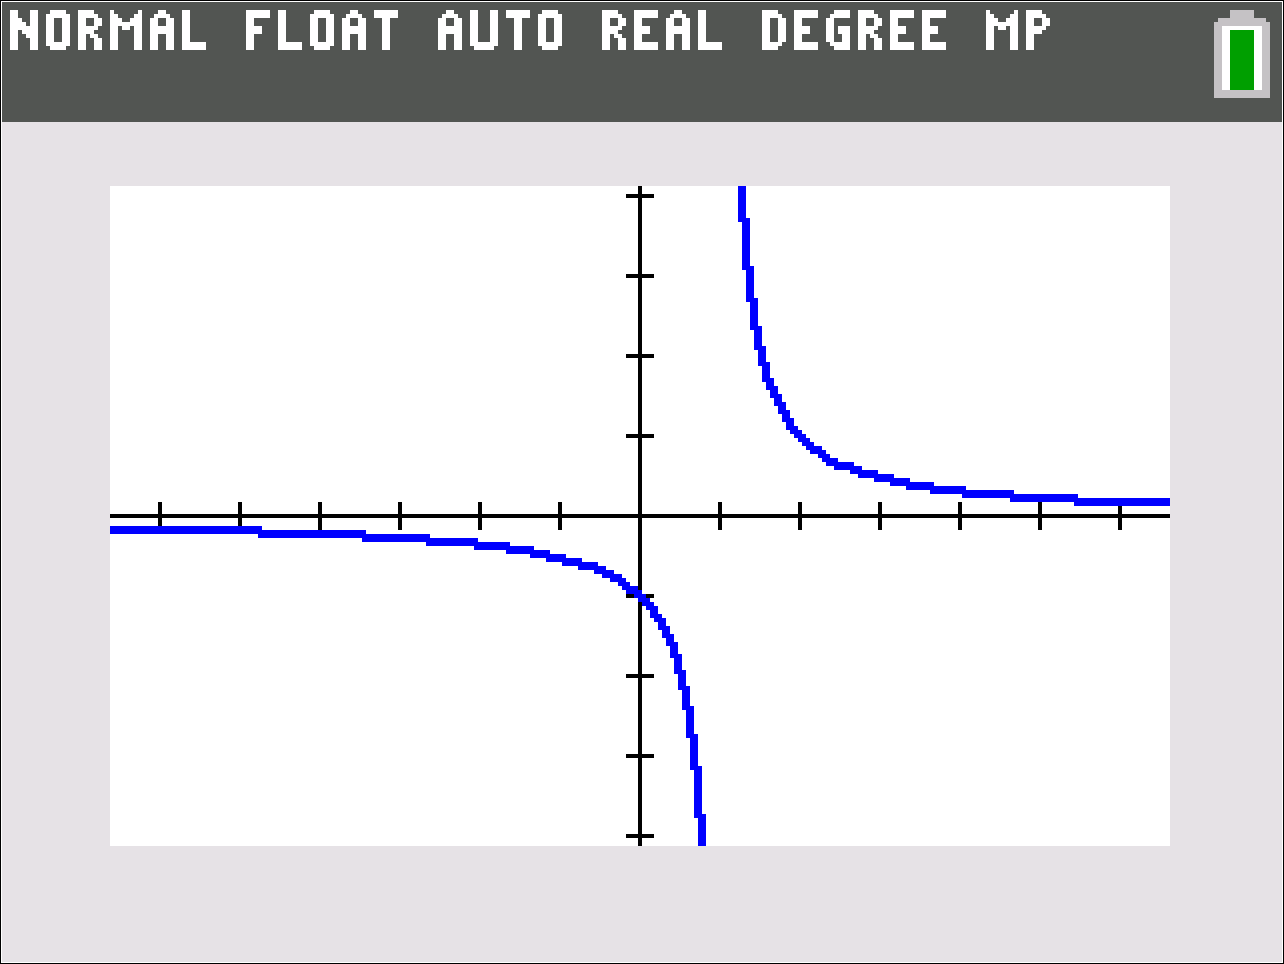
This is yet another standard example, but it really takes on life if you zoom in horizontally. Be sure to keep the vertical y range of the window the same, but investigate smaller and smaller horizontal x ranges centered at 0.
Epsilons and deltas of scaling — using “horizontal zooming”
The oscillatory example above illustrates the power of horizontal zooming as a motivation for the language of epsilons and deltas in formal limit definitions. I certainly don’t dwell on the formal definition in an introductory calculus class (and helpful tip — students are not expected to produce formal epsilon-delta proofs on AP® examinations). But, so you know, I do like to give my students some graphical sense or meaning behind the formal definition, which is formidable given its double quantifiers.
Game time: Try the following graphing “challenge” for students to play as a game.
If , then the graphing window must stay centered at (a, L). Player One can choose the vertical Y range as small as they’d like. Player Two cannot change this Y range, but must now zoom in horizontally (that is, make the horizontal X range narrow enough) so that the graph of y = f(x) stays entirely within the window, with the only allowable exception being at x = a itself.
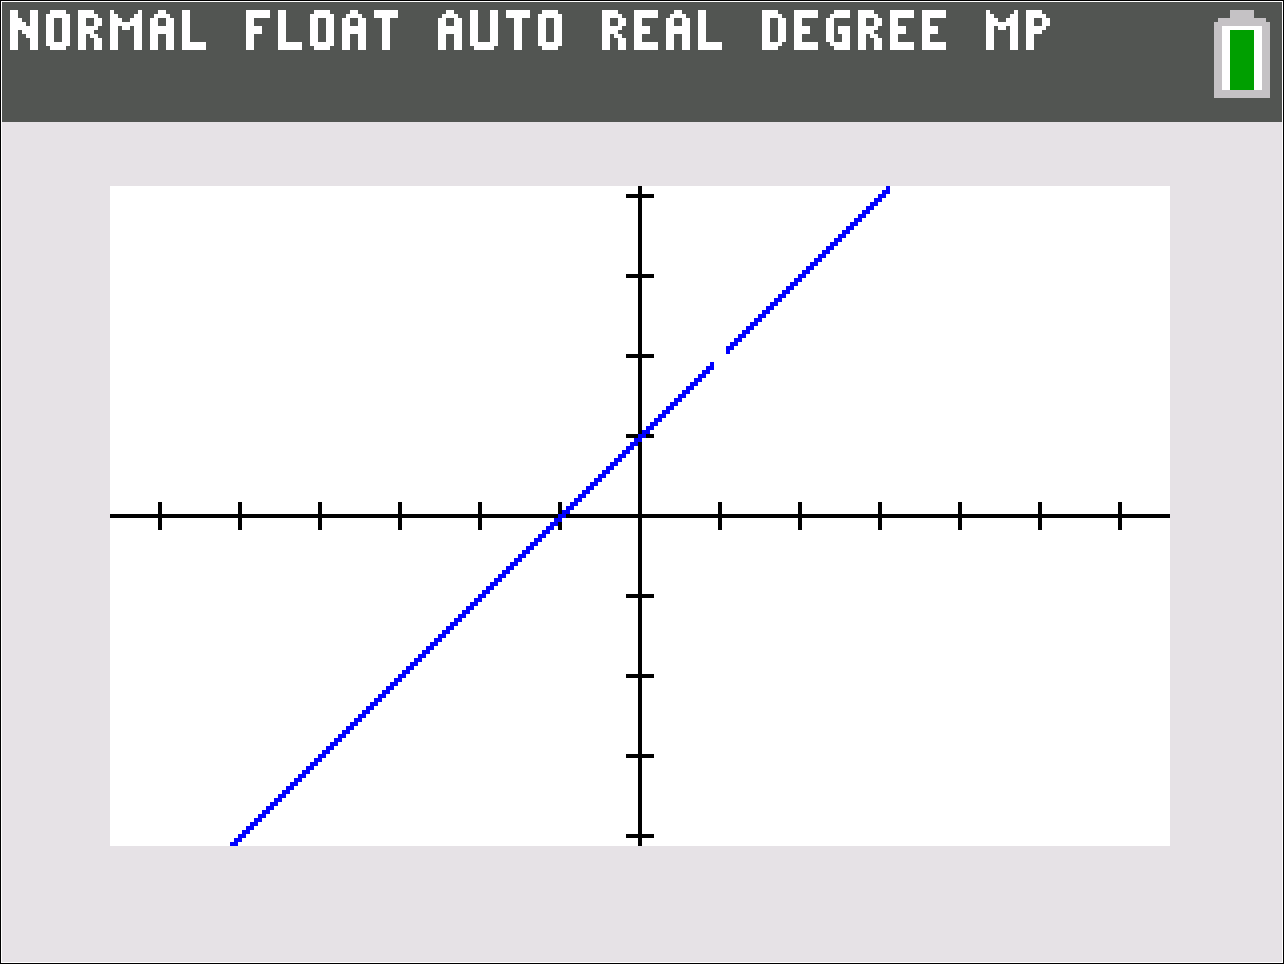
The vertical distance from the y = L to the top or bottom of the screen that Player One chooses is the “epsilon” (Ε) in the formal definition. The horizontal distance from x = a to the left or right of a screen that Player Two must choose to meet the graphing challenge and keep the graph within the window (except perhaps at x = a) is a corresponding “delta” (δ) in the formal definition. The meaning of is that Player Two can always meet the challenge. A simple example is shown below.
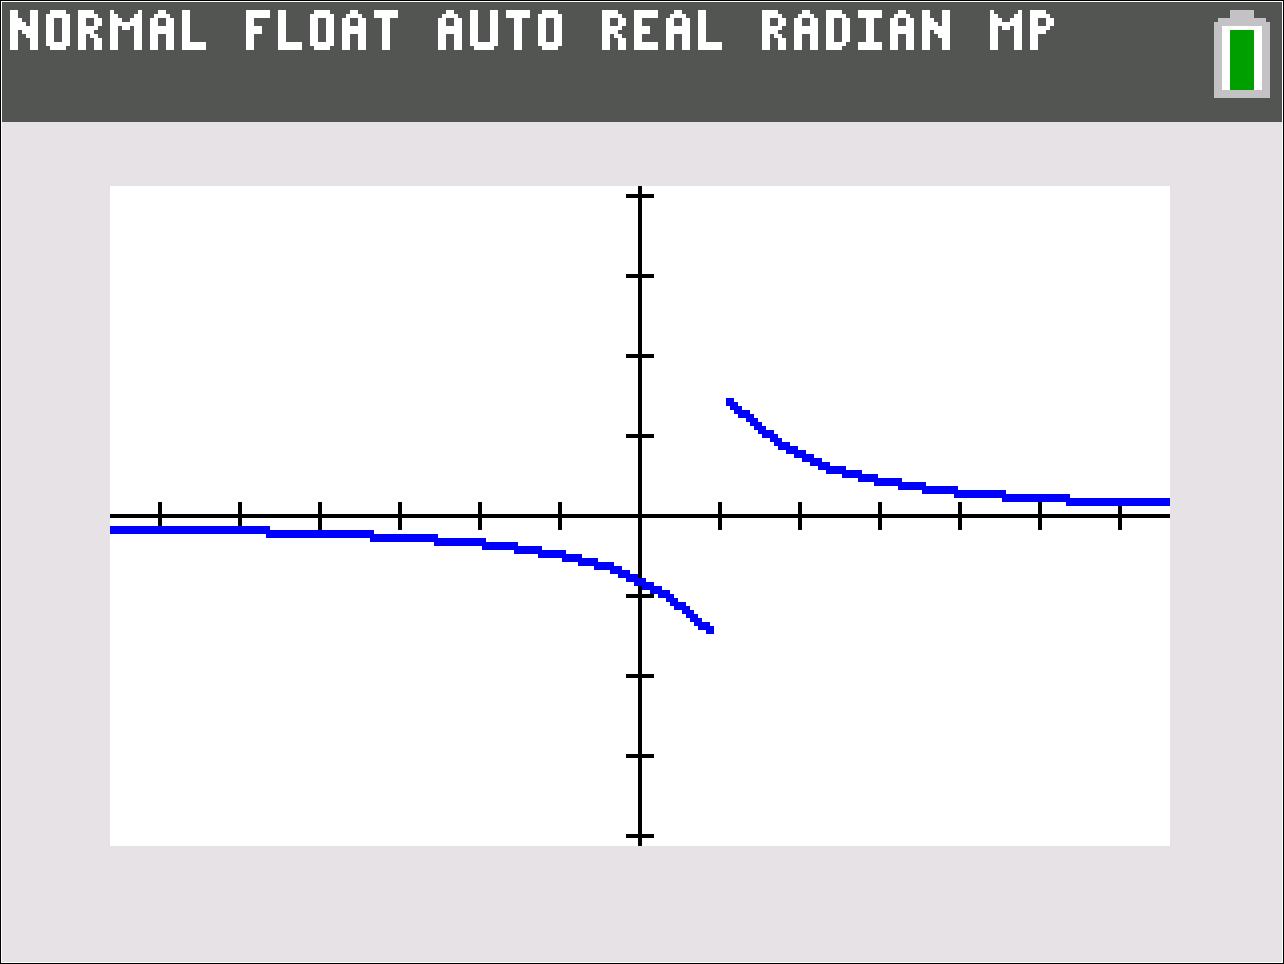
A good rule of thumb: Students playing this graphing challenge often find that Player Two can choose a delta that not only keeps the graph on screen, but makes the graph of y = f(x) appear identical to the horizontal line y = L itself. (That could have been posed as an alternative challenge to Player Two, but now the epsilon is essentially half the vertical height of a single screen pixel, so that all the y = f(x) values on screen are plotted on the same horizontal row of pixels centered at y = L.) There is a horizontal zoom out counterpart to this phenomenon for rational functions that have a horizontal asymptote. If and , then given any window centered at (0,L) , one can zoom out horizontally until the graph appears essentially identical to y = L.
Graphing calculators provide a powerful lever for mathematics sense-making. Can you teach a great calculus course without them? Of course! But I can’t imagine teaching calculus without graphing technology, for it can enrich any calculus course.
Part two coming soon.
AP® is a trademark registered by the College Board, which is not affiliated with, and does not endorse, TI products. Policies subject to change. Visit www.collegeboard.org.
About the author: Tom Dick, Ph.D., is a Senior Mathematics Advisor for Texas Instruments and is also Professor and former Chair of the Mathematics Department of Oregon State University. He has served on the Editorial Panels for the Journal for Research in Mathematics Education and the Mathematics Teacher. He remains active in the College Board’s Advanced Placement Calculus Program and has previously served as Chair of the AP® Calculus Test Development Community. Tom is also a lead author of the TI In Focus AP® Calculus video series.
Tagcloud
Archive
- 2026
- 2025
- 2024
- 2023
- 2022
-
2021
- January (1)
- February (2)
- March (5)
-
April (6)
- Top Tips for Tackling the SAT® with the TI-84 Plus CE
- Monday Night Calculus With Steve Kokoska and Tom Dick
- Which TI Calculator for the SAT® and Why?
- Top Tips From a Math Teacher for Taking the Online AP® Exam
- Celebrate National Robotics Week With Supervised Teardowns
- AP® Statistics: 6 Math Functions You Must Know for the TI-84 Plus
- May (1)
- June (3)
- July (2)
- August (5)
- September (2)
-
October (4)
- Transformation Graphing — the Families of Functions Modular Video Series to the Rescue!
- Top 3 Halloween-Themed Classroom Activities
- In Honor of National Chemistry Week, 5 “Organic” Ways to Incorporate TI Technology Into Chemistry Class
- 5 Spook-tacular Ways to Bring the Halloween “Spirits” Into Your Classroom
- November (4)
- December (1)
- 2020
- 2019
-
2018
- January (1)
- February (5)
- March (4)
- April (5)
- May (4)
- June (4)
- July (4)
- August (4)
- September (5)
- October (8)
-
November (8)
- Testing Tips: Using Calculators on Class Assessments
- Girls in STEM: A Personal Perspective
- 5 Teachers You Should Be Following on Instagram Right Now
- Meet TI Teacher of the Month: Katie England
- End-of-Marking Period Feedback Is a Two-Way Street
- #NCTMregionals Kansas City 2018 Recap
- Slope: It Shouldn’t Just Be a Formula
- Hit a high note exploring the math behind music
- December (5)
- 2017
- 2016
- 2015