5+ Tips for Using the TI-84 Plus in Your Math Class
Thanks for joining our Facebook Live office hours. If you missed it or want to watch it again, the video link is included below.
Five of my favorite tips are highlighted below, but you can view more of my favorite tips and tricks for the TI-84 Plus graphing calculator in this PDF.
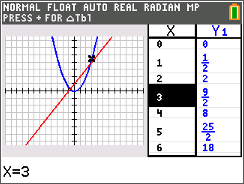
Tip 1: Viewing the Graph and Table Simultaneously
Did you know that you can see your graph and the table at the same time? Press y= and type your equations. In this screenshot below we use Y1= ½X² and Y2= X+1. Press the mode key and about midway through the screen you will see a row that says FULL HORTIZONTAL GRAPH-TABLE. Arrow over to GRAPH-TABLE and press the enter key. Now press the graph key and you will see your graph and table simultaneously. Press the 2nd key and then the graph key in order to arrow through the values in the table. To turn off this view, press the mode key and select FULL.
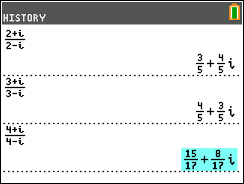
Tip 2: Using the Fraction Template
Press the alpha key then the y= key in order to get the fraction template. In the complex example below, I use the first template.
Tip 3: Investigating Transformation Graphing Using Lists
Press the stat key, then select the first option (1:Edit…). In the list L1 enter -2,-1,0,1,2. Now, press the y= key. In this example, we use Y1=X2-L1. To get L1, press the 2nd key then the stat key. You will notice that L1 is the first option. Press the graph key to see the screenshot below. Change your equation in Y1 to explore.
![]()
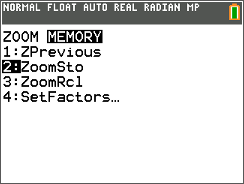
Tip 4: Storing Window Setting
You can store your favorite window setting into memory and recall it at any time. Press the window key and then change the window setting values to those you want to store. Then press the zoom key and arrow over to MEMORY. Then select ZoomSto and press enter. This setting will be stored until you reset the calculator or store a different window setting. To use the setting, press the zoom key, then arrow over to MEMORY and select ZoomrRcl.
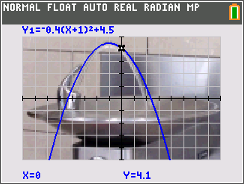
Tip 5: Equation That Graph
On the TI-84 Plus CE graphing calculator, you can use pictures to help your students test their understanding of transformation graphing. Press the 2nd key, then the zoom key. Arrow down to the row entitled Background. Arrow through the background choices until you get to Image4. Press the graph key. Students should then attempt to find the equation that models the curve in the image.
More Tips: For more tips and tricks download this PDF.
Watch the Video: TI-84 Plus Office Hours with Tom Reardon on Facebook Live.

Tags:
Tagcloud
Archive
- 2026
- 2025
- 2024
- 2023
- 2022
-
2021
- January (1)
- February (2)
- March (5)
-
April (6)
- Top Tips for Tackling the SAT® with the TI-84 Plus CE
- Monday Night Calculus With Steve Kokoska and Tom Dick
- Which TI Calculator for the SAT® and Why?
- Top Tips From a Math Teacher for Taking the Online AP® Exam
- Celebrate National Robotics Week With Supervised Teardowns
- AP® Statistics: 6 Math Functions You Must Know for the TI-84 Plus
- May (1)
- June (3)
- July (2)
- August (5)
- September (2)
-
October (4)
- Transformation Graphing — the Families of Functions Modular Video Series to the Rescue!
- Top 3 Halloween-Themed Classroom Activities
- In Honor of National Chemistry Week, 5 “Organic” Ways to Incorporate TI Technology Into Chemistry Class
- 5 Spook-tacular Ways to Bring the Halloween “Spirits” Into Your Classroom
- November (4)
- December (1)
- 2020
- 2019
-
2018
- January (1)
- February (5)
- March (4)
- April (5)
- May (4)
- June (4)
- July (4)
- August (4)
- September (5)
- October (8)
-
November (8)
- Testing Tips: Using Calculators on Class Assessments
- Girls in STEM: A Personal Perspective
- 5 Teachers You Should Be Following on Instagram Right Now
- Meet TI Teacher of the Month: Katie England
- End-of-Marking Period Feedback Is a Two-Way Street
- #NCTMregionals Kansas City 2018 Recap
- Slope: It Shouldn’t Just Be a Formula
- Hit a high note exploring the math behind music
- December (5)
- 2017
- 2016
- 2015