AP® Statistics: 6 Math Functions You Must Know for the TI-84 Plus
Students and teachers are getting prepared for another unique year of AP® exam administrations. While we don’t know if the paper and digital administrations will be the same format as prior years, several features of the TI-84 Plus CE Graphing Calculator will still be useful for you. In this post, I have compiled a list of 6 of the most important statistics features to know for the TI-84 Plus CE.
1: Regression Analysis
It is unlikely that you will be asked to draw a scatterplot on the exam; however, being familiar with creating and analyzing a scatterplot of bivariate data could prove crucial. Make sure that your regression diagnostics are turned on. Be aware that, when fitting a linear regression model to a set of data, the residuals are automatically stored in a list called RESID. Remember to investigate a residual plot to confirm whether your proposed regression models the data well. Refer to the video below for steps for doing this on your calculator.
2: Normal Probabilities
The computation of probabilities for random variables that are normally distributed is a core concept in the course. You can expect a question involving a normal probability computation on the AP® Statistics exam. The normalcdf( command takes inputs of the mean, standard deviation, and an lower and upper boundary. This is helpful because it means you do not need to standardize (turn to z-scores) the values before using the command. Since you are allowed boundary values, you don’t have to apply the compliment rule. To find the probability that X takes a value between 65 and 86 if X is normally distributed with mean 70 and standard deviation 15, follow the steps in the video below.
3. Binomial Probabilities
You know the verbal cues to recognize when a question is about a binomial context, but which probability menu item do you use for a given situation? If the question is asking for the probability of a single outcome (i.e. what’s the probability of exactly 5 heads in 10 coin flips [hint: it’s not 1/2!]), then you should use binompdf(10,.5,5). If the question is asking about the probability of more than 5 heads in 10 coin flips, then you need binomcdf( . Keep in mind that binomcdf( is cumulative from 0 to k successes, so pay close attention to whether to subtract the endpoint, or not, when using the compliment rule. Always remember that for the free-response section you must show the correct work and justification for the computation. The exam readers will not accept “calculator speak” as justification; i.e. “1 - binomcdf(10,.5,5)” is not considered sufficient communication of work. This video shows an example of this kind of computation.
4: Random Variables
In some cases, you are asked to calculate the mean or standard deviation of a random variable given in a table. You can use a little-known feature of the 1-Var Stat command to generate the summary statistics for a random variable by putting the values of the variable in one list and the probabilities in another list. When using the 1-Var Stat wizard, select the list containing the values of the variable, and for the Freq list, use the list where the probabilities were stored. In the example below, L1 was the values of the variable and L2 was the list of probabilities.
5: Checking Conditions
Rarely on the exam will you be asked directly to make a graph of univariate data. But, when checking the conditions for an inferential procedure involving means, knowing quickly how to generate a graph of data and determine its relative shape is important. Use a modified boxplot (option 4 in the StatPlots menu) or a histogram (option 3) to assess the shape of a sample distribution for strong deviations from approximately normal. Use ZoomStat to set the window quickly . More steps are included in the video below.
6: Inferential Procedures
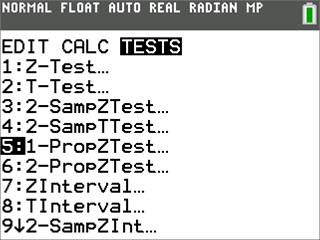
As sure as the sun will rise tomorrow, you will be asked to carry out an inference procedure on the free response portion of the exam. You may be given sample statistics to work with or perhaps a small data set to input. Either way, you must be sure to know which type of inferential procedure to do. Key words like “provide evidence” or “significant” are indications that you are being asked to test a pair of hypotheses. “Estimate” or “confidence” gives indication that an interval is appropriate to answer the question. Be sure to be familiar with each type of inferential procedure, including its outputs. Recall that the t-procedures are required when dealing with questions about a population mean or difference in two population means. Inference procedures for proportions are indicated by “Prop” in the title of the command on the calculator. A Chi-squared test for homogeneity has the same mathematics as a Chi-squared test for independence, so there is only one Chi-Squared test option for these tests. To located the TESTS menu, press the stat button then arrow right to TESTS.
If you are looking for more practice with these features and several others, check out the AP Statistics Office Hours with Daren Starnes series of on demand sessions and materials here.
About the author: Curtis Brown currently works as the Math Segment manager at Texas Instruments. He taught mathematics and AP® Statistics for several years. Since starting at TI in 2015, he has led many content development projects including the Math in Motion series. He has always found joy in exploring the patterns and logic of mathematics. In his spare time he enjoys kayaking and fishing with his sons and spending time with his family. Follow him on Twitter and Instagram @cbmathguy.
Tagcloud
Archive
- 2026
- 2025
- 2024
- 2023
- 2022
-
2021
- January (1)
- February (2)
- March (5)
-
April (6)
- Top Tips for Tackling the SAT® with the TI-84 Plus CE
- Monday Night Calculus With Steve Kokoska and Tom Dick
- Which TI Calculator for the SAT® and Why?
- Top Tips From a Math Teacher for Taking the Online AP® Exam
- Celebrate National Robotics Week With Supervised Teardowns
- AP® Statistics: 6 Math Functions You Must Know for the TI-84 Plus
- May (1)
- June (3)
- July (2)
- August (5)
- September (2)
-
October (4)
- Transformation Graphing — the Families of Functions Modular Video Series to the Rescue!
- Top 3 Halloween-Themed Classroom Activities
- In Honor of National Chemistry Week, 5 “Organic” Ways to Incorporate TI Technology Into Chemistry Class
- 5 Spook-tacular Ways to Bring the Halloween “Spirits” Into Your Classroom
- November (4)
- December (1)
- 2020
- 2019
-
2018
- January (1)
- February (5)
- March (4)
- April (5)
- May (4)
- June (4)
- July (4)
- August (4)
- September (5)
- October (8)
-
November (8)
- Testing Tips: Using Calculators on Class Assessments
- Girls in STEM: A Personal Perspective
- 5 Teachers You Should Be Following on Instagram Right Now
- Meet TI Teacher of the Month: Katie England
- End-of-Marking Period Feedback Is a Two-Way Street
- #NCTMregionals Kansas City 2018 Recap
- Slope: It Shouldn’t Just Be a Formula
- Hit a high note exploring the math behind music
- December (5)
- 2017
- 2016
- 2015