Math and Python: A Great Valentine’s Day Couple
Python + Math = true love!
This Valentine’s Day activity had a simple beginning. My good friend, Julie Riggins, and I were asked the question, “Will you do a Valentine's Day themed webinar?” Did we have a large bank of activities to draw from? Did we have a single idea? Nope. So, of course we said yes. We leaped straight off the cliff. Whether we figured out how to fly, or crashed horribly into the ground, is for someone else to decide.
We each came up with an idea. Riggins created a wonderful activity. While using Python, students learn about slope as they work to deliver flowers from Jack’s house to Diane’s house. (Yes, “Jack & Diane” dates us a little bit, but it’s a fun song.) By the way, I love Riggins’ virtual flowers.

If you want to learn more about Riggins’ activity, read to the end, and you can watch the webinar from Feb. 8, 2022, here.
For me, I decided to create an activity where students use Python to shoot cupid’s arrow through a heart while learning about linear and quadratic functions. This activity can be done either on a TI-Nspire™ CX II or TI-84 Plus CE Python graphing calculator. The commands are the same, but the menus are arranged differently. Note that in this blog, I have used the TI-Nspire™ CX II graphing calculator to demonstrate the activity, and all screenshots have been taken from this handheld.
Is your heart beating faster? Maybe even skipping a beat? Let’s take a closer look at how to create a Python program that has cupid shooting his arrow through a heart, and it just might even win over your students’ hearts in math class.
Getting started and setting up the graph
First, we must lay the foundation for the activity. Here we are going to start the program and add in all the basic graphing elements. In Python, you need to define your window and put in your axes. To help see where the points are located, we will also add a grid to our graph. Let's add some color too, because everything is better in color!.
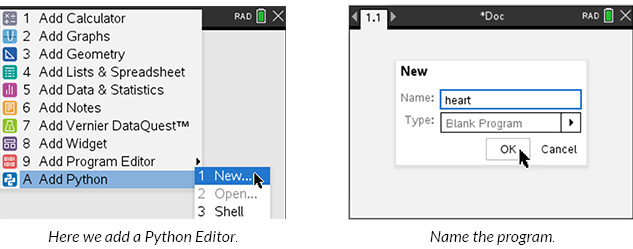
First, you will need to open a new document and add a Python Editor.
Doc > File > New Document > Add Python > New
Now, have your students type in a name for their program. Click on OK. I named my program “heart.”
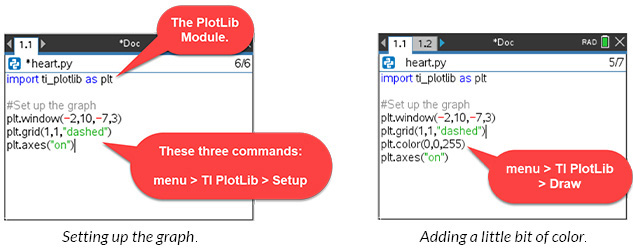
We are going to use Python’s PlotLib module. Python is designed to use as few resources as possible. Each module can add functions, classes and variables. Basically, each one adds more commands to be used. Think of Python as a giant bookshelf that only has a few books on it. Adding a module is like adding a new book and thus new information to the bookshelf. The PlotLib will add commands to let us set up and draw our graph.
Add the PlotLib module: menu > TI PlotLib > import ti_plotlib as plt
Now that we have access to the commands we need, have the students set their window, add the grid, add the axes and pick a color.
Once the students have added these elements, I would encourage the students to play for a little bit. Have them run the program and see what happens. To run a Python program, press ctrl then R (ctrl + R). Ask them to rearrange the commands and run it again. What happens? What do they learn from the results? Have them play with the color. The color is based on a mixture of red, green and blue. Each of the colors can vary in value from 0 to 255. What colors can they make?
Preparing for the picture (and some math)
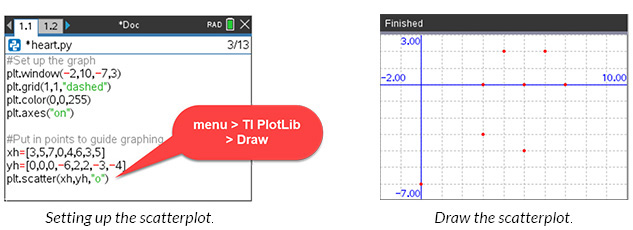
We are going to shoot an arrow through a heart. So, we need to draw a heart. And, if you are going to draw a picture, you need dots. How else are you supposed to draw a picture if you don’t have dots to connect? (My best artwork always involved books where you connect the dots.) We are going to graph our dots by graphing a scatterplot. First, we will type in two lists:
xh = [3,5,7,0,4,6,3,5]
yh = [0,0,0,-6,2,2,-3,-4]
I chose xh to be the name for the x-coordinates of the heart and yh to be the y-coordinates of the heart. You can use any names you want. Have fun. Personally, I went for short names.
Using the lists, we can now draw the scatterplot. Have the students put in the code and run the program.
(ctrl + R)
Can they make the dots red?
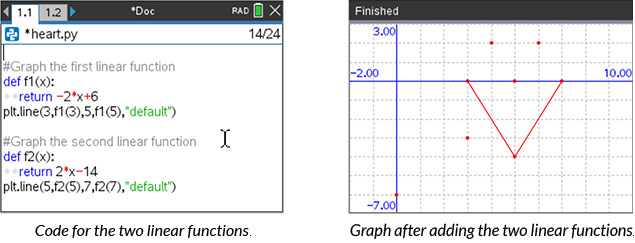
Drawing the first linear function from (3,0) to (5,-4)
As we start drawing the heart, we are going to move away from the most efficient program in favor of emphasizing the math. To do this, we are going to use Python’s function structure.
The first function is going to draw a line from the point (3,0) to the point (5,-4). This will be the left side of the bottom of the heart. I would help the students put in the function and the plt.line command, but I would have them decide what function to put beside the “return” command. Have them run the program after they come up with their function. If the line does not connect the two points, have them try again. The graph of the line will serve as formative assessment for the students. Be sure to encourage your students if the line is incorrect. Coding is always a process of testing and correcting code.
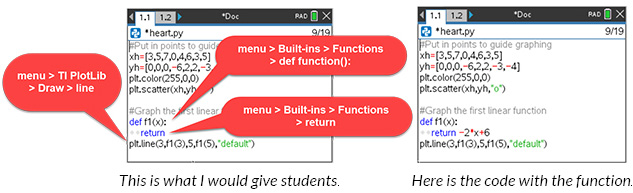
Note about the command plt.line: The 3 and f1(3) are the x,y-coordinates of the first point of the line segment being plotted, and the 5 and f1(5) are the x,y-coordinate of the last point. This is a nice opportunity to make a connection to domain of a function or limiting a domain.
Draw the second linear function from (5,-4) to (7,0)
The second linear function is going to draw a line from the point (5,-4) to the point (7,0). This will be the right side of the bottom of the heart. Ask your students to add new code and use the same structure as the first line to graph this second line. Again, have the students run the program to see if they have the correct line.
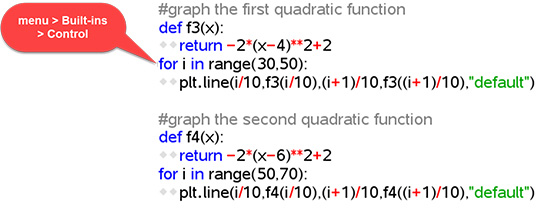
Drawing the two quadratic functions through (3,0), (4,2), (5,0) and (5,0), (6,2), (7,0)
Again, we are going to use the function structure and the plot line command. There is not a predefined command to graph curved functions in Python, but they are still easy to graph. We are going to use a “for loop” to draw a lot of very short little lines to produce our quadratic functions.
Here is the code for the two quadratic functions:
Notes about the quadratic code:
- It may seem strange at first for the range to run from 30 to 50 in the “for loop,” but Python does not allow steps that are not integers. So, if you want to take a small step, you have to be creative. We want to run a graph from 3 to 5 with steps of a tenth. So, we go from 30 to 50 with steps of 1 and then divide each i by 10.
- Python represents an exponent using **. So, if you want x squared, you would write, x**2.
- I would recommend approaching the quadratic functions exactly like the linear functions. I would help the students put in and understand the code for the first quadratic function, but I would not give them the equation for the first quadratic function. I would have them write the code for the second quadratic function themselves.
- If you have not covered quadratic functions by Valentine’s Day, I would recommend connecting all of the dots using linear functions. It may not look quite as good, but it still would be educational and fun.
Firing the arrow through the heart
This part of the code is just for fun. You can certainly ask the students to write the function that graphs a line between the points (-6,0) and (3,-3). I would give them the rest of the code and ask them what they think it does. Once they input the code, encourage them to run the program and have fun with it.
If the arrow is moving too fast, you can slow it down. Go back to the top of the program and add the time module:
menu > More Modules > Time > from time import*
You slow the loop down by adding a sleep command. To make it work, add sleep(0.03) in the loop right after the last plt.line command. Make sure the sleep command is indented. You can find sleep here: menu > More Modules > Time.
If you wish to see Riggins’ and my webinar, you can find it here. You can also download a handout of this activity to try with your students.
Most of all, have fun, and have a Happy Valentine’s Day!
About the author: Adam Pennell received his undergraduate degree from the University of North Carolina and completed his doctorate in mathematics at North Carolina State University. He taught for three years at Bluefield College, and he has spent the last 24 years teaching at Greensboro College. He is a T³™ National Instructor, and he loves exploring new ways to help students learn. When Pennell is not teaching, he enjoys spending time with his wife and son. He has been married to Janet for 30 years, and his son is almost 12.