Graphing Calculators Are Now Approved for the AP® Biology Exam, but What Else Can I Do With Them?
Earlier this year, the College Board® allowed students to use a graphing calculator on the AP® Biology exam. As mathematical thinking and data analysis have become a bigger part of the AP® biology curriculum, it makes sense to enable students to take advantage of the learning that a graphing calculator permits.
Most biology teachers may be wondering what can be done with graphing calculators other than graphing and calculating. To answer this question, let’s take a look at a few of the Science Practices for AP® science courses as published by the College Board®. Within each practice, there are examples of how a Texas Instruments (TI) graphing calculator can help students achieve the outcomes outlined.
Science Practice: The student can use representations and models to communicate scientific phenomena and solve scientific problems.
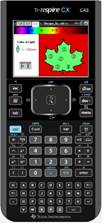
With the TI-Nspire™ CX graphing calculator, students can explore simulations of scientific phenomena by graphing data on topics such as weather patterns, chemical reactions and water quality. All of the simulation-based content is free and can be downloaded at www.sciencenspired.com. Because of the flexibility of the TI-Nspire™ platform, you can create, edit and distribute activities to students that cater to your teaching style.
|
This example shows how the stomata of a leaf would react based on wavelengths of light. |
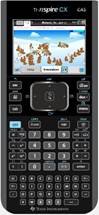
This example shows how certain alleles are selected in various populations and in different environmental conditions. |
Science Practice: The student can use mathematics appropriately.
TI graphing calculators are math tools. They are intended to be used by students to explore all aspects of mathematics and how math can be used to explain phenomena. Whether by graphs, calculations, equations, functions or data, these tools should be used to help students better understand the world around them with the power of mathematics. From a biology perspective, you can have students explore the probability of Punnett Squares, or determine allele frequencies using the Hardy–Weinberg Equilibrium. If your students are exploring predator-prey relationships, they can plot and overlay multiple graphs for an easier visual of that dynamic relationship.
Science Practice: The student can plan and implement data-collection strategies in relation to a particular scientific question.
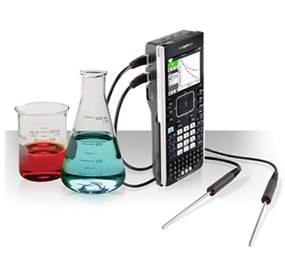
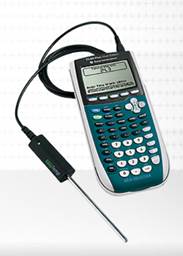
Using sensors turns the graphing calculator into a lab or field data-collection unit. TI graphing calculators connect to Vernier sensors through various interfaces. With support of over 70+ sensor types, all of the AP® biology labs are covered. In addition, analysis of the data collected is much easier using a tool designed for mathematical analysis. Use a number of different analysis techniques most appropriate for the question your students are exploring.
Science Practice: The student can perform data analysis and evaluation of evidence.
Once the experiment or observation concludes, the data-analysis features on a TI graphing calculator can help students make sense of the phenomenon they just witnessed. With the help of Vernier Software & Technology’s applications that are built into TI graphing calculators, students can view the data in multiple representations. From there, they can generate reports using screen captures of the data analysis they performed.
TI graphing calculators are permitted on all of the AP® Physics exams, AP® Chemistry exam, and now the AP® Biology exam. Take full advantage of these tools in the classroom, lab and field to help students explore the world around them. And when exam time comes up in May, they’ll be even more prepared to show what they know. Good luck to you and your students on the next AP® Biology exam.
AP® and College Board®are trademarks registered by the College Board, which is not affiliated with, and does not endorse, TI products. Policies subject to change. Visit www.collegeboard.org.
About the author: Erick Archer is the market strategy manager for science and stem education at Texas Instruments.
Tagcloud
Archive
- 2026
- 2025
- 2024
- 2023
- 2022
-
2021
- January (1)
- February (2)
- March (5)
-
April (6)
- Top Tips for Tackling the SAT® with the TI-84 Plus CE
- Monday Night Calculus With Steve Kokoska and Tom Dick
- Which TI Calculator for the SAT® and Why?
- Top Tips From a Math Teacher for Taking the Online AP® Exam
- Celebrate National Robotics Week With Supervised Teardowns
- AP® Statistics: 6 Math Functions You Must Know for the TI-84 Plus
- May (1)
- June (3)
- July (2)
- August (5)
- September (2)
-
October (4)
- Transformation Graphing — the Families of Functions Modular Video Series to the Rescue!
- Top 3 Halloween-Themed Classroom Activities
- In Honor of National Chemistry Week, 5 “Organic” Ways to Incorporate TI Technology Into Chemistry Class
- 5 Spook-tacular Ways to Bring the Halloween “Spirits” Into Your Classroom
- November (4)
- December (1)
- 2020
- 2019
-
2018
- January (1)
- February (5)
- March (4)
- April (5)
- May (4)
- June (4)
- July (4)
- August (4)
- September (5)
- October (8)
-
November (8)
- Testing Tips: Using Calculators on Class Assessments
- Girls in STEM: A Personal Perspective
- 5 Teachers You Should Be Following on Instagram Right Now
- Meet TI Teacher of the Month: Katie England
- End-of-Marking Period Feedback Is a Two-Way Street
- #NCTMregionals Kansas City 2018 Recap
- Slope: It Shouldn’t Just Be a Formula
- Hit a high note exploring the math behind music
- December (5)
- 2017
- 2016
- 2015