How to Use the TI-84 Graphing Calculator to Succeed on the Enhanced ACT Math Test


|
About the author: Jeff McCalla, author of “TI-84 Plus CE Graphing Calculator for Dummies,” 2nd ed. (Wiley, 2022) and “TI-Nspire for Dummies,” 2nd ed. (Wiley, 2011), teaches math at St. Mary’s Episcopal School in Memphis, Tennessee. McCalla received the Presidential Award of Excellence in Mathematics and Science Teaching in 2009. |
Standardized tests have a way of asking questions that go past number crunching and take a dive into the concepts. Often these questions reveal misconceptions that students may have or just introduce a topic that they haven’t really had a chance to explore. The fascinating part is that usually the questions are over common topics, but the tests take an uncommon approach to asking a question.
Let’s explore ACT® questions that do precisely that. They challenge students to think differently about solving problems.
As a math teacher and the test-prep coordinator at St. Mary’s Episcopal School in Memphis, Tennessee, I enjoy the challenge of preparing students to tackle these demanding questions. This article highlights six sample questions from recent ACT math tests along with tips for solving them using your TI-84 Plus CE graphing calculator.
- Finding Zeros on a Graph
- Using the Polynomial Root Finder
- Using the Simultaneous Equation Solver
- Solving Imaginary Number Problems
- Graphing Piecewise Functions
- Understanding Right Triangle Trigonometry Problems

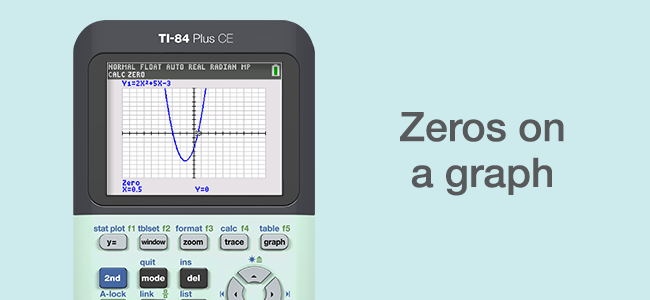
1. Finding Zeros on a Graph
In high school algebra, students spend a lot of time studying quadratics. Even so, this question is likely one that students haven’t spent much time thinking about. (In fact, how do you think about it?)
With the help of their graphing calculator, students can visualize the mathematics in a way that I have trouble showing with pencil and paper.

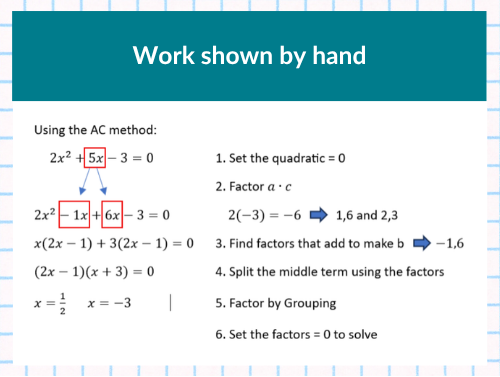
The standard form of a quadratic is: ax 2 + bx + c. Many high school students have trouble factoring when the leading coefficient is not 1. I know there are a lot of different factoring methods, including a few CRAZY methods I see when I tutor students!
If the leading coefficient is not 1, the AC method is my go-to method when factoring by hand.
Here it makes sense to graph the quadratic. I recommend students put the quadratic in standard form first. In this case, subtracting 3 from both sides gives: 2x2 + 5x - 3 = 0.
How to make your background look like graph paper:
- Press [2nd][zoom] and choose Gridline.
How to graph a quadratic (with a 10 × 10 window):
- Press [y=] and enter the quadratic: 2x 2 + 5x - 3 in Y1.
- Press [zoom] [6] to graph.
How to find the zeros on a graph:
- Press [2nd] [trace] to access the Calculate menu.
- Press [2] to choose the Zero command. I entered -1 for the left bound, 2 for the right bound (because I wanted to find the positive zero).
- Press [enter] to find the positive zero of the quadratic.
Watch the video to see the steps.
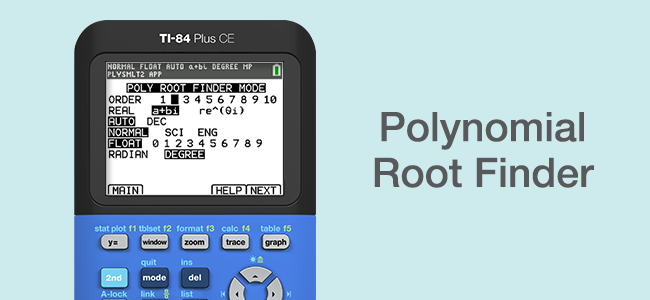
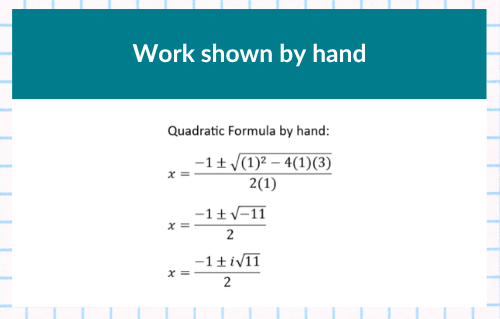
2. Using the Polynomial Root Finder
What if you can’t factor and the answers to the quadratic are imaginary? A graph doesn’t help much except to tell you that the quadratic doesn’t have any real solutions.
Don’t worry — your graphing calculator has an app for that!
Using the Polynomial Root Finder app:
- Press [apps], choose PlySmlt2, then choose Polynomial Root Finder.
- Adjust the settings to select Order (Degree):2 choose PlySmlt2 and a + bi mode as shown.
- Press [graph] to activate the on-screen NEXT button.
- Fill in the constant and coefficients as shown.
- Press [graph] to activate the on-screen SOLVE button.
- To change fractions to decimals or vice-versa, press [graph] to activate the on-screen F ◀▶D button.
Watch the video to see the steps.
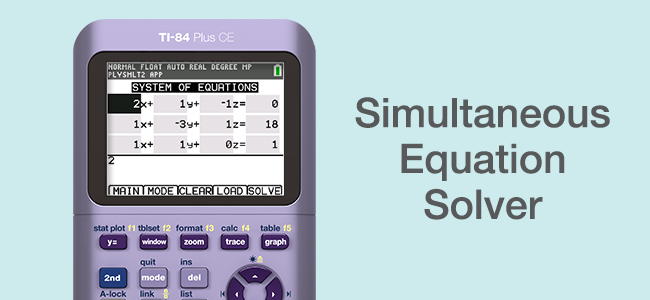
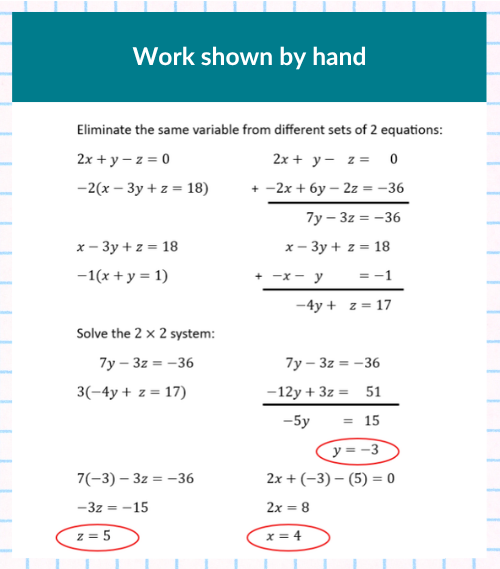
3. Using the Simultaneous Equation Solver
Time is a huge issue on the Enhanced ACT. Students have about 1 minute and 7 seconds per question — and the difficulty ramps up faster than the legacy version. (Solving a 3 × 3 using the Gaussian method by hand takes a lot of time!) What if using your TI-84 made you more accurate and faster?

How to use the Simultaneous Equation Solver app:
- Press [apps], choose PlySmlt2, then choose Simultaneous Eqn Solver.
- Adjust the settings to select Order (Degree):2 and a + bi mode as shown.
- Press [graph] to activate the on-screen NEXT button.
- Fill in the constant and coefficients as shown.
- Press [graph] to activate the on-screen SOLVE button.
Watch the video to see the steps.
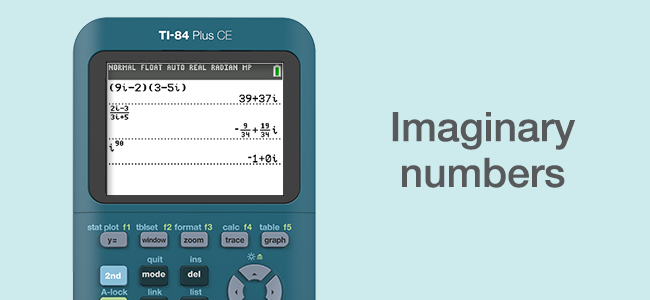
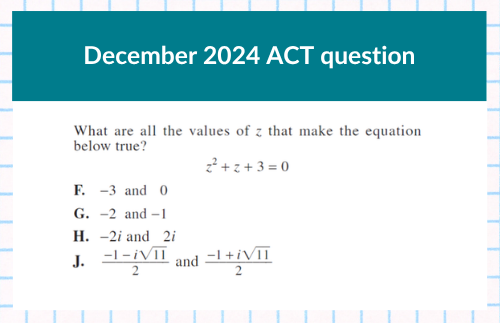
4. Solving Imaginary Number Problems
Another time-saver is doing imaginary number problems in the graphing calculator. I want students to be able to solve these problems by hand, but if they can save time by using their calculator on the ACT math test — that’s the plan.

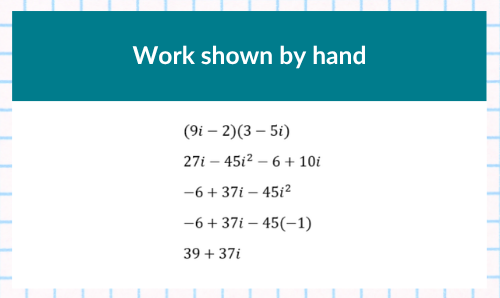
To enter the imaginary number i in your graphing calculator, just press [2nd] [.].
Oh, and did you know your calculator can simplify fractions with i in the denominator? It can mostly handle large powers of i into the thousands. (If you’ve been teaching for a while, you know that the older TI-84 Plus graphing calculator could only handle up to i4.) Occasionally, the zero part of an answer still may be displayed in scientific notation.
Watch the video to see the steps.
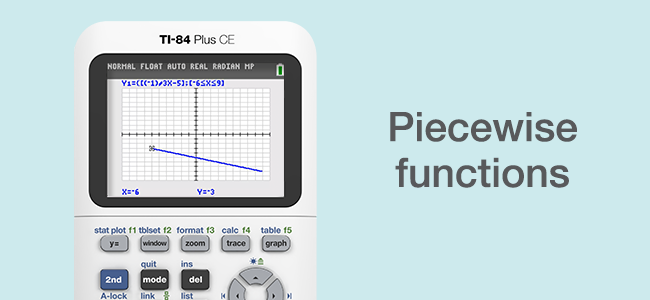
5. Graphing Piecewise Functions
Many students have trouble understanding domain and range, even after repeated attempts by math teachers to explain the concept.

A mentor teacher of mine, Ms. Halfacre, always recommended teaching domain and range with piecewise functions. Did you know the TI-84 Series can graph piecewise functions?
How to graph piecewise functions:
- Press [y=] and navigate to an empty Y1 equation.
- Press [math] and scroll up two clicks and choose Piecewise(.
- Adjust the number of piecewise function to 1 as shown.
- Enter the function in the left entry.
- Use your arrow keys to go to the right entry space, then enter the domain.
- Press [2nd] [math] to enter an inequality.
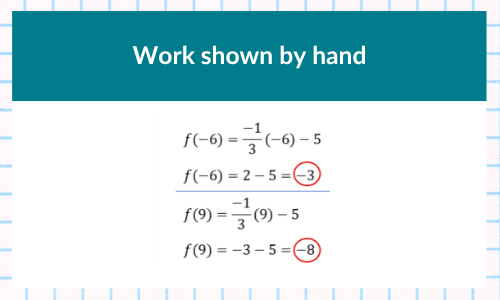
- Press [zoom] [6] to graph, then press [trace].
- I entered [9] to see the y-value when x = 9.
Seeing both the graph and the table on the same screen:
- Press [mode] and choose Graph-Table (used to be called G-T in the TI-84 Plus).
- Then press[2nd] [graph] to control the point from the table.
Using Graph-Table is one of my favorite features on the TI-84 Series. In fact, NCTM recommends we show multiple representations at the same time. I love the way the display toggles from point to point exactly as I hoped it would.
Watch the video to see the steps.
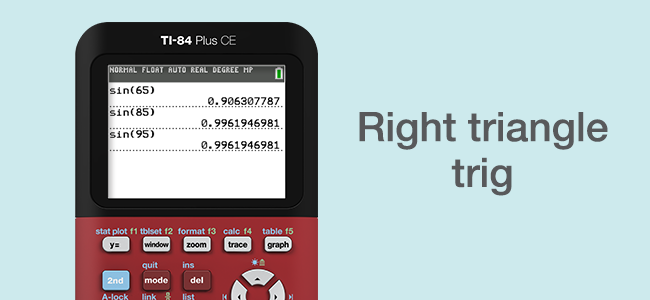
6. Understanding Right Triangle Trigonometry Problems
I’m often surprised by which types of questions students have trouble with, but I can assure you this next one gives students fits. It may not look that tough, but I think it uncovers a misunderstanding that many students have when working with trig ratios.
Here is a question from December 2020 ACT:

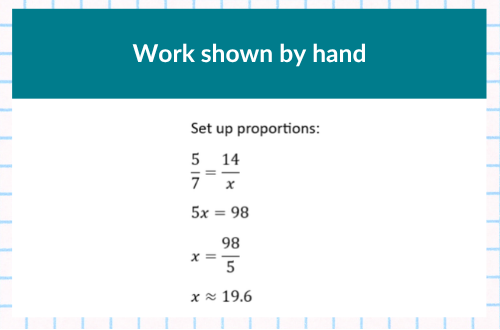
When students learn Soh-Cah-Toa, they are told that the "o" stands for opposite side, "a" for the adjacent side, and "h" for the hypotenuse. So, when students see, sin(D) = 5⁄7 , they immediately think that the opposite side is 5 and the hypotenuse is length 7.
This is a very confusing problem for a couple of reasons.
The opposite side is already labeled 14 and none of the answer choices for the length AC is 7. It boils down to students not understanding that sine, cosine and tangent are RATIOS. In other words, the numerator is not necessarily the length of the adjacent side when calculating the cosine, and so on.
So, how could we introduce the concept of trig ratios so that the students understand the concept? I like to use technology as an exploration tool for students. Once students learn that sine is the ratio of the opposite side to the hypotenuse, show them the image below and have them use their graphing calculator to determine the sine of the three angles (65°, 75° and 85°).
Ask them:
- What do you think the sine of 90° would be?
- Test your conjecture by finding the sine of (88°, 89° and 90°)
- Why is the sine of 90° the limit for how big the sine of an angle can be?
Watch the video to see the steps.
By taking the numerator and denominator out of the discussion, the students may be able to see the concept that the ACT question so masterfully incorporated into their question.
Additional ACT Prep Resources
I recommend students get to know their graphing calculator — it can pay off in big ways on the ACT math test.
If you want more tips and strategies that will help on the ACT, these additional blog posts are for you.
If you’re a teacher interested in learning more about TI-84 Series and the ACT exam, check out this T3™ workshop. You can explore samples of the activities and strategies from the workshop by watching this free webinar.
ACT is a registered trademark of ACT, Inc., which does not endorse TI products. Policies subject to change. Visit www.act.org.