Going for Gold: 5 Sports-Themed Activities to Engage Your Students
It’s that time again! Every four years there is a worldwide international athletic competition that features the very best athletes in the world. On July 23, these athletes began to assemble in Japan in a much-anticipated competition since it was delayed by one year due to a global pandemic. Not only is this an exciting time for the athletes but also for fans of the sports they represent. Many of us will be glued to our televisions watching the “best of the best” do their thing and experiencing the excitement and drama of it all from our couches.
Educators will be among those mesmerized with the stories they see but may find their own minds racing on all the rich opportunities for sports-related ideas to engage students in the math and science classroom. Let’s take a look at five activities you can try with your students.
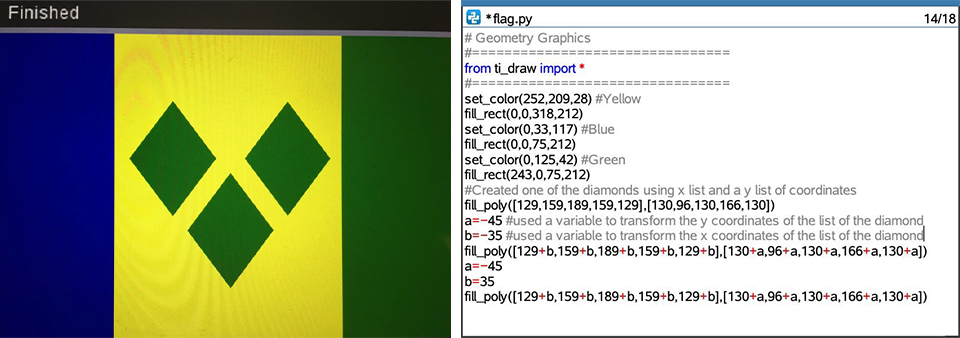
1. Code the Flag
This year, there will be approximately 10,000 athletes competing from 205 countries (however there are only 195 countries; a great topic for discussion) in 31 sports. The flag for this worldwide event has five interlocking rings which are symbolic of the five continents where the athletes come from (again, another interesting discussion topic). The five different ring colors represent all the colors of the flags of the world.
To set the stage for exploring some sports-themed activities, why not have your students first get in the mindset by coding their favorite country’s flag. If you have some artistic students, they can use the TI-Nspire™ CX II graphing calculator or the new TI-84 Plus CE Python graphing calculator — it could be a fun challenge!
Below is the flag of St. Vincent and the Grenadines, coded with Python. The flag colors can be created using rectangles, and it is a great lesson for students to learn about the order in which commands (and thus colors) are executed in order to obtain their final design. The symmetry of the three diamonds in the flag create an opportunity to apply a transformation to the middle diamond in order to place the other two.
2. Let’s Talk About the Bling
Winners of an event, or sport, will be awarded with a medal comprised of gold and other metals. Students may be surprised by this fact alone! The weight and diameter of each of the medals is as follows:
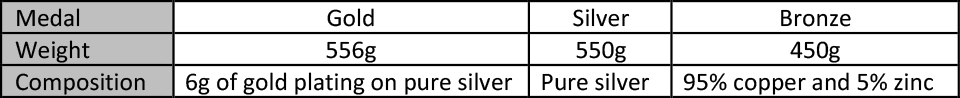
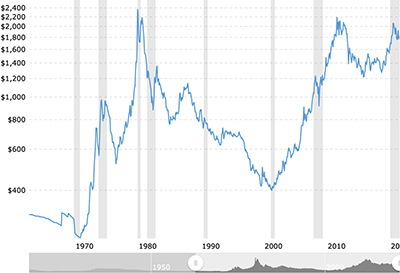
With this information, along with the current gold prices, students can calculate how valuable (financially, of course) a gold medal is versus a silver medal. Students can find the historical value of gold per ounce (interactive chart below), and see what years would be a better year to win. However, I think any year is a good year to win a gold medal. Gold medals are required to be made from at least 92.5% silver and must contain a minimum of 6 grams of gold. All medals must be at least 60mm in diameter and 3mm thick.
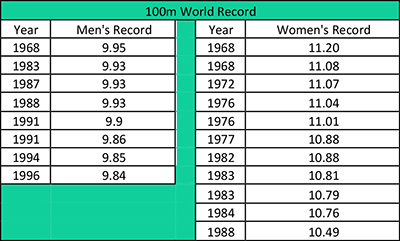
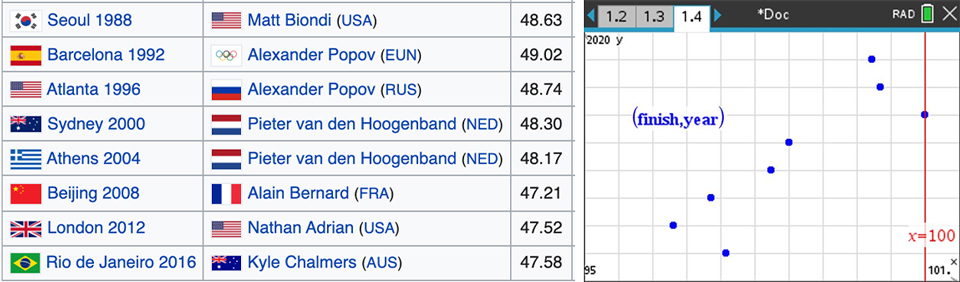
3. Who is the “World’s Fastest Human?”
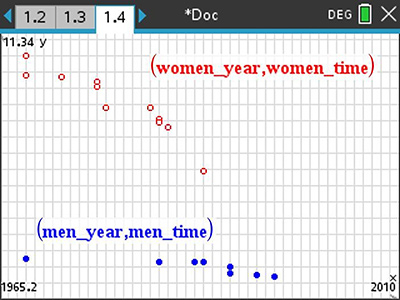
One of the premier events in track and field is the 100-meter sprint. It determines who is the “world’s fastest human.” There are many activities that students can do with the available data from the 100-meter sprint. Here is a table with the progression of the men’s and women’s world record in this event. Using a TI-Nspire™ CX, TI-Nspire™ CX II or TI-84 Plus CE graphing calculator, students can easily plot the data and make predictions based upon the data.
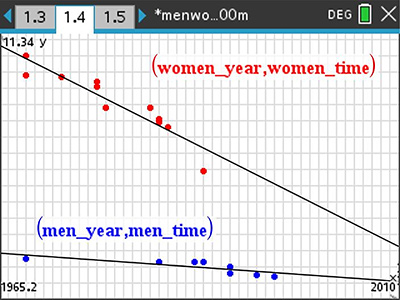
Here is the data plotted on a TI-Nspire™ CX II graphing calculator. You could keep the last data point from the students, not that they won’t quickly look it up, and have them make predictions based upon what they see. What do they predict will be the world record in the year 2030?
Use this scatterplot to prompt the following student questions:
- What do you notice about the men’s and women’s data?
- What do you think might happen in the future?
- Will the women be running faster than the men and, if so, when will that happen?
- What will the time for the 100-meter world record be if/when the two are equal?
This table contains the split times for each 10-meter interval for an entire 100-meter race for each world record set through 2009. (RT = reaction time and is included in the 0–10 meter time.)
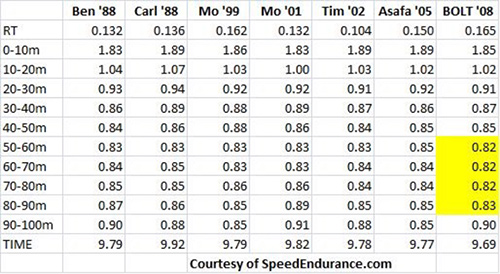
With this data, students could plot and investigate many different ideas such as:
- Plot time versus distance
- Calculate velocity
- Calculate acceleration
- Plot distance versus velocity
- Calculate how fast they are running in miles per hour
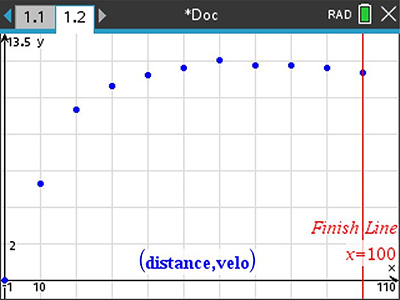
In the screenshots above, the distance of the race was plotted against the velocity for the 10-meter interval. What might be surprising is that, even though the runner is moving extremely fast, they are actually slowing down.
4. So Who’s the Shark?
Let’s take the speed exploration to the water. Take a list of all the past gold medal winners in the 100-meter freestyle swim, and have students calculate speed for the 100-meter. Then have them try to display them all on the same scatterplot, and see how they would have compared to the fastest finisher in that event. It might take some thought on how to do this, but that’s the fun of it. The New York Times had a nice video of all the winners throughout history in a virtual finish.
5. Keeping it Real
Having students use real images is another great way to use their calculator to analyze math. Did you know you can import images onto your TI-Nspire™ CX or TI-Nspire™ CX II graphing calculator?
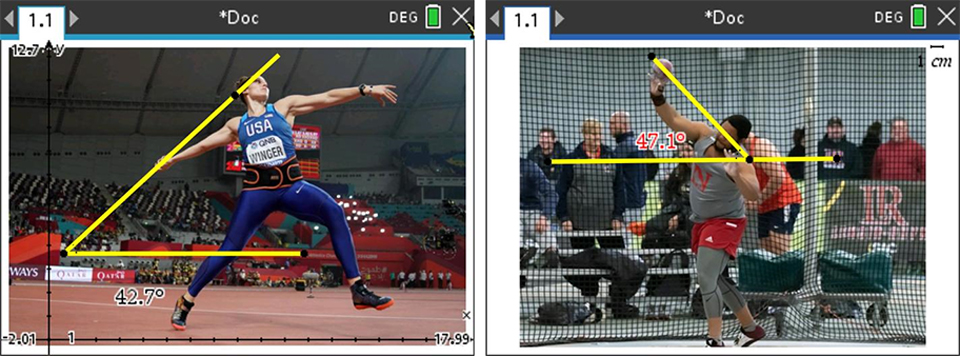
Example 1: Javelin toss
Students can look for photos online to import onto their TI-Nspire™ CX family graphing calculator to do an analysis of the initial angle of a javelin toss. This could be a great springboard to launch (no pun intended) a discussion of projectile motion or even a way of incorporating parametric equations. Questions to ask students might include:
- What is the optimal angle for a projectile such as a discus or shot put?
- Are those optimal angles the same, or do they differ with the item being thrown?
Students can also use the geometry feature in the graph application to draw line segments on the images, and then measure the angle that they create, as shown below. This could lead nicely to activities that involve parametric equations and initial angle questions.
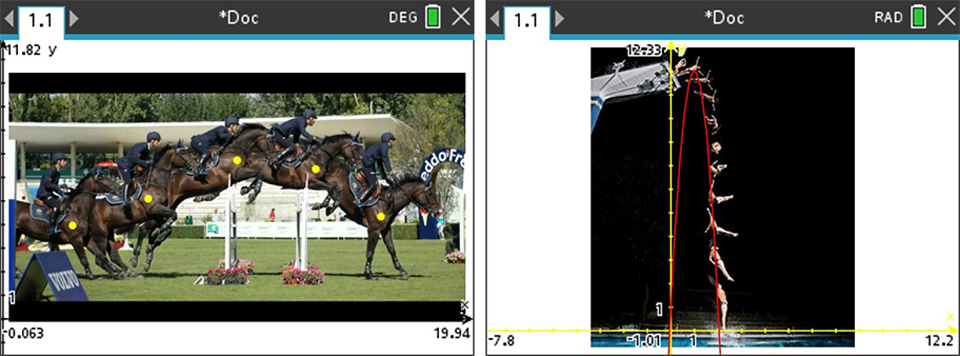
Example 2: Horse jumping or diving
Students could also plot points on the shoulder of a horse in the sport of equestrian using the geometry menu on the TI-Nspire™ CX II graphing calculator, and see the parabolic path it makes as it successfully clears a barrier. This could also be done with a diver. Challenge the students to fit or model a curve to it by entering an appropriate function into the graph entry window. Through some trial and error, they should be able to better fit their curve to the image.
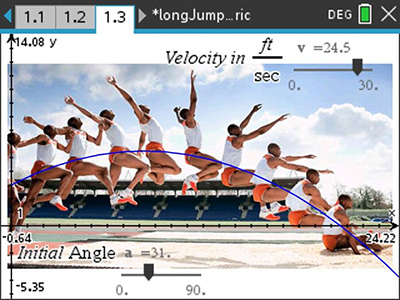
Example 3: Long jump or triple jump
Long jump or triple jump images can be used along with some parametric equations to see how changing certain parameters will affect the distance of a jump. Questions to ask students might include:
- Is it possible to jump high while running as fast as possible?
- Is there too big of a takeoff angle?
This one is particularly exciting to me — have I mentioned I am a track and field coach too? I would strongly suggest letting students experience this for themselves. Take the students out to your school’s track, and play! Have them run and jump into the sand. See who jumps the farthest; have them experiment with different ideas on how to go farther. A nice activity to check out with similar exploration can be found on the Science Nspired page in the physics section, called “Projectile Trajectories.”
The “Field Goal for the Win” activity on the STEM Behind Sports webpage is another great opportunity to have students dig deeper into parametric equations. Be sure to check out the other activities Texas Instruments (TI) has featured on their STEM Behind Sports page.

Finally, another great resource worth checking out is The National Science Foundation (NSF). The NSF collaborated with NBC Sports on a series of sports-based activities to highlight STEM. It is still archived on their site and can be found here.
By giving your students a choice on what to explore, they will surprise you with their ideas and questions. And no matter what sports they may choose to explore, they will certainly experience a rich, relevant and engaging math lesson. Now, grab your popcorn, sit on that couch, and let’s go watch some sports!
Be sure to check out the recently posted webinar : “Math + Physics = A Gold Medal Combination” for more ideas on incorporating sports themed content into your teaching.
About the author: Brad Posnanski (@POSitive_MATH) teaches algebra I, precalculus, Introduction to STEM and AP® Computer Science Principles at Comsewogue High School on Long Island in New York. He has been teaching for 25 years and also coaches varsity track and field. He is a national T³™ instructor presenting regularly at Texas Instruments international conferences, several Tuesday night national TI webinars, and local state teacher conferences. He is a firm believer in the integration of technology in the teaching of mathematical concepts to make learning more fun and interesting.