Day of the Dog: Which Dog Is Roundest?
Who doesn’t love dogs? In fact, did you know there is a day devoted to celebrating “man’s best friend”? International Dog Day! Every year, on Aug. 26, International Dog day is observed to raise awareness about dog adoption and the importance of providing rescue dogs with a safe and loving environment. International Dog Day celebrates dogs of all breeds. It also highlights animal cruelty prevalent in society.
Anyone who knows us, knows we like dogs, a lot! And of course, we love mathematics too! Currently, we have seven dogs, and they pretty much run the show in our house. The problem is that we have never been able to find a way to merge our love of math with our dogs until we were asked to lead a webinar for Pi Day: “P³ — Puppies, Probability and Pi.”

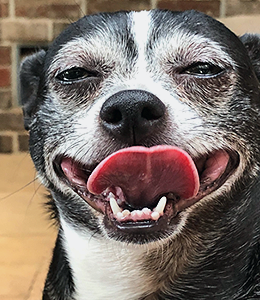
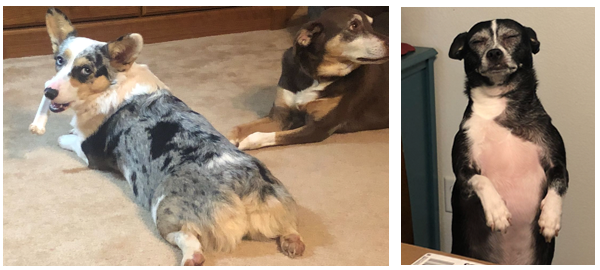
Of the many dogs in our house, Holly and Blue are the two dogs that best qualify for the descriptor “round.” Holly is a 7-year-old Chihuahua with a short temper who comes in at a staggering 17 lbs. Blue is a 5-year-old corgi with a friendly personality and a loud bark, who is beginning to develop the dreaded “belly hang down” of a middle-aged dog.
Which dog is the roundest?
Study design and data collection
So as good scientists, we began with a question we wanted to answer. Which led us to our first step: designing a study to collect data. We seek to gather accurate and reliable data without any bias. We settled on the following process:
- On the same day, we would measure the circumference and diameter of both dogs at the same locations (more on that later).
- We would be sure to measure the diameters of both dogs from their right side rather than the top or left side of the dog.
- Next, we would plot the data from each dog separately and calculate the residuals of each data from the known formula for circumference (C = πd).
- For each dog, the Residual Standard Error would be calculated and compared.
- The dog with the smaller Residual Standard Error would be deemed the “roundest.”
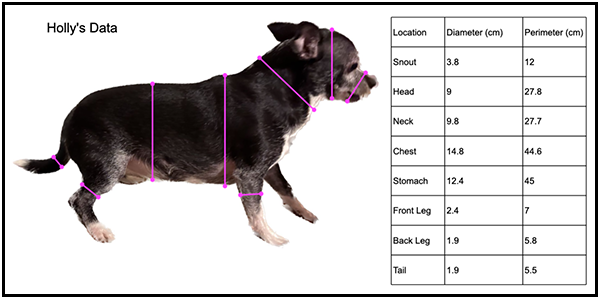
Data collection is Tracy’s specialty. She is very precise in all that she does. Because of this trait, and the fact that she is the only human that Holly actually likes, Tracy did all the measurements. Even given Holly’s affection for Tracy, there was some squirming and a bit of growling by the end of the data collection. Despite that, the following data was collected:
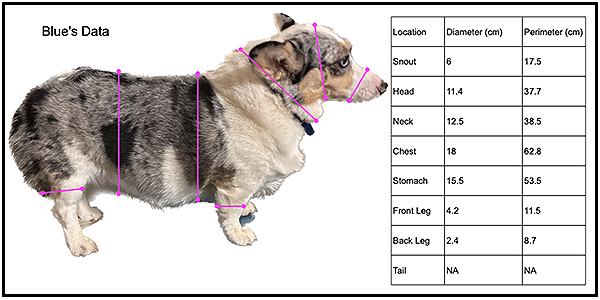
Blue was a bit more cooperative, but she was confused by what her mom was up to and was a bit leery when a tape measure was wrapped around her snout, but in the end her data was gathered:
Data analysis
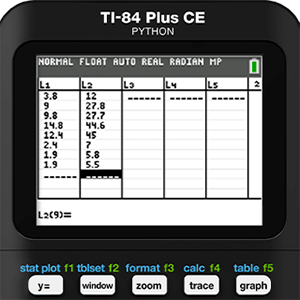
We will begin with Holly’s data. The data gathered was entered into Lists L1 and L2 of a TI-84 Plus CE Python graphing calculator. Next, a scatter plot was created of this data in a ZOOMSTAT window.
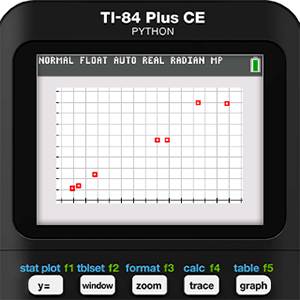
Upon first glance, Holly’s data seems to have a positive linear correlation. While it is tempting to run a linear regression at this point, we decided that did not make sense in this situation. Why look for a mathematical model when we know the model relating circumference to diameter? That is what makes this activity different from many other data collection activities we have done in the past. Perhaps that is what we like best about this activity. Most modeling activities we have seen attempt to create a model from the data. Instead, this activity turns that around to see if a set of data matches a given model. It is a subtle difference, but we believe an important one.
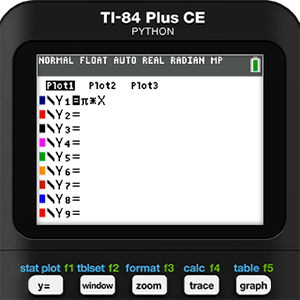
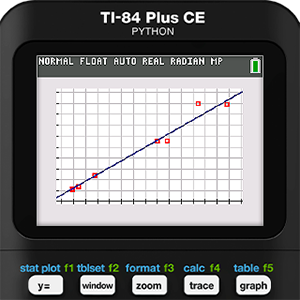
Next, the circumference function was entered into Y1 and then graphed with the data. It was at this point that we started to realize we might be onto something. Holly’s data was pretty close to the model function. It was also at this point that we considered changing Holly’s diet.
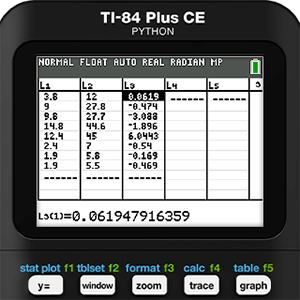
Mathematical modeling is never as simple as running a bunch of regressions and picking the one with the r-value closest to 1 or -1, which is another reason we have come to love this activity so much. Residuals should be an important part of the process, but since we didn’t run a regression we will need to use the features of the calculator to find them manually. As a reminder, a residual is defined as the actual measured y-value minus the y-value predicted by the model. So, in this case we use list operations and enter the formula L2 - Y1(L1) in the heading for L3.
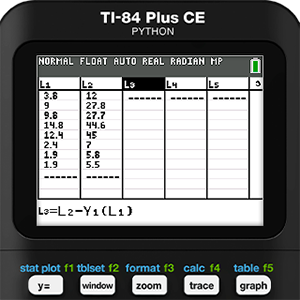
As is common with residuals, some values are positive and others are negative. We cannot just work with them this way because we don’t want them canceling each other out. The practice in statistics is to square these residuals. This will result in all positive values. Then the squared values are added, then divided by the degrees of freedom. The degree of freedom is the number of values in a data set minus the number of parameters in the model. For Holly’s data, the degree of freedom will be 8 - 1 = 7. Finally, the square root of that number is found to give the Residual Standard Error (RSE). The formula is provided below.
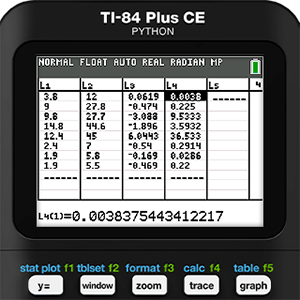
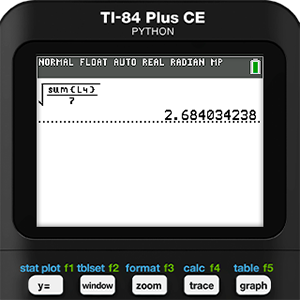
To complete this formula for Holly, we need to square L3 in the next list, L4. Then in the home screen we can take the square root of the sum of L4 divided by 7. This gives Holly a Residual Standard Error of 2.684.
Using the same data analysis technique for Blue with a degree of freedom of six (because she doesn’t have a tail), we get a Residual Standard Error of 3.472. By our study, Holly is determined to be the “roundest.”
Summary
Even though this study started with a bit of a joke, it took us to some interesting mathematical places. We love that we have designed a study that relates geometry, algebra and statistics while still being accessible to a student with an algebra I background. Statistics and mathematical modeling are only going to become more and more important in the classroom. It really is time to start digging into experimental design and data analysis with students of all ages.
To celebrate National Dog Day in your classroom, Holly and Blue encourage you to do this activity or a similar study with your students.
About the authors: Corey Boby has a Master of Science degree in mathematics from Ohio University. He has worked as a teacher and curriculum specialist for over 20 years and taught a range of math classes both in person and virtually at the high school and college levels in Arkansas. He has served as an AB Calculus Reader for eight years and has been a T³™ National Instructor since 2001. Being named a PAEMST Awardee in 2017 was one of the highlights of his career along with performing the marriage ceremony for one of his former students in 2021.
Tracy Watson has a Master of Science degree in mathematics from Ohio University. She has taught at the college level for over 15 years and at the high school level for seven years. During her high school teaching years, she taught AP® Statistics and served as a College Board AP® Statistics Reader for four years and has been a T³™ National Instructor since 2001. Tracy has previously served on the Arkansas Council of Teachers of Mathematics Board in a variety of positions including President. Tracy is currently working at the Arkansas School for Mathematics, Sciences, and the Arts as a Mathematics Specialist teaching residential students and supporting a network of Arkansas Statistics teachers.
AP® is a trademark registered by the College Board, which is not affiliated with, and does not endorse, TI products. Policies subject to change. Visit www.collegeboard.org.