Building Bridges with Math + Engineering

This week is Engineers Week, the perfect time for math and science teachers to hug-it-out and work together to get students excited about engineering. But how, you say? Well, what goes left to right and looks like a straight line? Linear relationships, of course! And, whether they know it or not, this is a concept that students definitely see in both their math and science classes.
In the spirit of Engineers Week, we’ve created a lesson that “builds bridges” between math and science concepts. To help get you started, we’ve outlined some tips that will help you plan a fun – and meaningful – project for your students.
Tip 1: Raid your science teachers’ closets. As a math teacher, your closet is full of things only you think are fun – protractors, compasses, and stacks of graph paper. Science teachers get all the good stuff: funny-looking glassware, vented goggles, lab coats. But what you want to keep an eye out for are sensors and data collecting devices. In the case of our project here, you will need: your very own TI graphing calculator, a Vernier force sensor, 20 washers, string (we used fishing line), a small screw eye, and a popsicle stick. Grab a lab coat while your there – you never know!

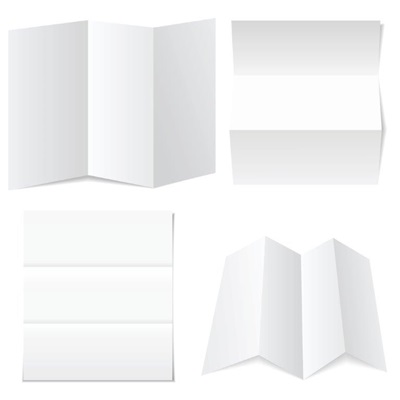
Tip 2: Folding paper is hard. This is definitely a skill; some kids have it and some just don’t. Your students’ goal: build the strongest bridge using only paper. I know you can already hear the whining and the list of questions. The answers are: yes, a strong bridge; and yes, using only paper. This is a time to get creative and for students to learn some basics of engineering. Psst, we built a “guardrail” into our bridge. Feel free to keep that tidbit of information to yourself until you feel like the kids have grappled with this problem long enough.

Tip 3: Science is perfect. Lab equipment is not. Don’t expect to see a perfectly straight line. Your data collecting instruments probably aren’t up to NASA’s snuff, so expect what scientists and engineers call “noise” in the data you collect. It’s OK. In our tests, the washers we used exerted almost the same amount of force as the noise level on the force sensor. The noise will be accounted when you run the regression. That noise will show up as a y-intercept in your regression equation. Now you know why. You can breathe now.

Tip 4: Gravity is a harsh mistress. Want some math that will blow your mind? This crazy thing happened as we wrote this lesson – we discovered gravity. Well, actually we found a neat way to model Newton’s Second Law; F = m*a. In our activity, the mass of the washers is the dependent variable and the downward force on the force sensor is the independent variable. The slope of the regression line is approximately 9.8 – which you will recognize from your physics classes as the gravitational constant, g. So all that time we spend telling students that they will “use this someday”, well, this is a great example. When we talk about how much weight the bridge can support, we are really talking about the downward force exerted on the structure, due to the mass of the washers and gravity. Pretty neat stuff.

We hope this helps breathe some math into an ordinary bridge-building lesson. Happy Engineers Week!
Tagcloud
Archive
- 2026
- 2025
- 2024
- 2023
- 2022
-
2021
- January (1)
- February (3)
- March (5)
-
April (7)
- Top Tips for Tackling the SAT® with the TI-84 Plus CE
- Monday Night Calculus With Steve Kokoska and Tom Dick
- Which TI Calculator for the SAT® and Why?
- Top Tips From a Math Teacher for Taking the Online AP® Exam
- Celebrate National Robotics Week With Supervised Teardowns
- How To Use the TI-84 Plus Family of Graphing Calculators To Succeed on the ACT®
- AP® Statistics: 6 Math Functions You Must Know for the TI-84 Plus
- May (1)
- June (3)
- July (2)
- August (5)
- September (2)
-
October (4)
- Transformation Graphing — the Families of Functions Modular Video Series to the Rescue!
- Top 3 Halloween-Themed Classroom Activities
- In Honor of National Chemistry Week, 5 “Organic” Ways to Incorporate TI Technology Into Chemistry Class
- 5 Spook-tacular Ways to Bring the Halloween “Spirits” Into Your Classroom
- November (4)
- December (1)
-
2020
- January (2)
- February (1)
- March (3)
- April (1)
- May (2)
- July (1)
- August (2)
- September (3)
-
October (7)
- Tips for Teachers in the time of COVID-19
- Top 10 Features of TI-84 Plus for Taking the ACT®
- TI Codes Contest Winners Revealed
- Best of Chemistry Activities for the Fall Semester
- Best of Biology Activities for the Fall Semester
- Best of Physics Activities for the Fall Semester
- Best of Middle Grades Science Activities
- November (1)
- December (2)
- 2019
-
2018
- January (1)
- February (5)
- March (4)
- April (5)
- May (4)
- June (4)
- July (4)
- August (4)
- September (5)
- October (8)
-
November (8)
- Testing Tips: Using Calculators on Class Assessments
- Girls in STEM: A Personal Perspective
- 5 Teachers You Should Be Following on Instagram Right Now
- Meet TI Teacher of the Month: Katie England
- End-of-Marking Period Feedback Is a Two-Way Street
- #NCTMregionals Kansas City 2018 Recap
- Slope: It Shouldn’t Just Be a Formula
- Hit a high note exploring the math behind music
- December (5)
- 2017
- 2016
- 2015
