Slope: It Shouldn’t Just Be a Formula
Understanding Slope Is More Than Computing It
When I first started teaching, I taught algebra I to ninth-graders. My students were similar to most — highly energetic kids that, quite honestly, had more important things on their mind than mathematics. Let’s face it: their understanding of the slope of a line was limited, at best. In my mathematical mind, the first thing I needed to do was “correct” that. I believed if they only understood how to compute it, they would “understand” slope. Boy, was I wrong. In order for the computation of slope to be understandable, students needed to first tackle the concept of slope as rate of change.
Slope as Rate of Change in Context
In many, if not all, cases, we care about the interpretation of the slope of a line between two points far more than the actual value of it. Instead of offering students points between which they might find the slope, start by offering contexts where that makes sense. Maybe it’s a graph of the distance between a person and a wall vs. time, the graph of temperature of water as it cools on a stove, or a graph of the number of pounds of bananas there are on the table at a grocery store from open until close. These don’t have to be linear. Have students talk about how things change in relation to one another, and use vocabulary like: increasing, decreasing, at a constant rate, and at an increasing/decreasing rate. The goal is to associate the features of the graph with what is happening contextually.
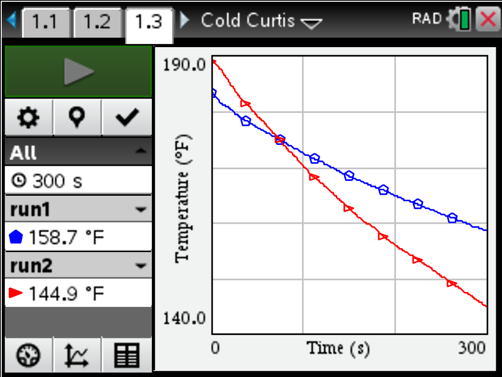
For example: Consider the above graph. Ask your students what they notice and what they wonder about the temperature of water over time from two different data collections. As the conversation grows, guide the conversation toward the concept of rate of change. Try to get students talking about which collection they believe was done outside in South Dakota in January, and which was performed inside a conference center (steering clear from numerical values, at least at first).
Rate of Change (aka Slope) as Demonstration
Once students have a grasp on how the visual cues describe the relation, it’s time to investigate the numbers. I like to start with a demonstration of the “value” of the slope first. Consider another one of the above examples. Have your students act out a graph of the distance a person is from a wall vs. time. In the graph below, I used the CBR 2™ device to collect distance vs. time data. Once students have had a chance to experiment with walking toward and away from the wall at different rates, they will have a better ability to connect the graph to what’s really happening. The conversation should naturally lead to developing the concept of rate of change.
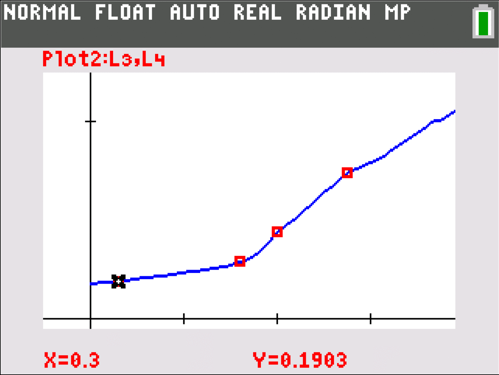
For example: How far away was the person at seconds? How far at seconds? At 2 seconds? At 2.75 seconds? So over which interval, 0.3 to 1.6 or 2 to 2.75 seconds, was the person moving at a faster average rate? How do you know?
A conversation like the above, especially after the students have physically acted out some distance vs. time graphs, lays a solid foundation for computing rate of change (slope) and why it might be relevant.
Calculation of Rate of Change
The base layer has been laid by interpreting graphs and then acting out distance vs. time relationships. Now, the final step: Based on the prior two demonstrations, students should now have the tools with which they can begin talking about how slope might be calculated. Suppose we use the delta notation 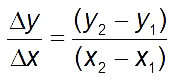 , talking about “change in y” per “change in x” instead of the traditional
 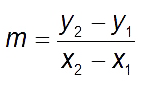 . Since students’ understanding of
slope has come from experiencing two values changing together, the connection with the actual computation will be much stronger.
I truly believe that students who address the slope between two points as it relates to a context have a far better opportunity to understand the computation of slope and what it means than those who approach it from a formula first. (My apologies to the students I had in my early years of teaching.)
Tagcloud
Archive
- 2026
- 2025
- 2024
- 2023
- 2022
-
2021
- January (1)
- February (2)
- March (5)
-
April (6)
- Top Tips for Tackling the SAT® with the TI-84 Plus CE
- Monday Night Calculus With Steve Kokoska and Tom Dick
- Which TI Calculator for the SAT® and Why?
- Top Tips From a Math Teacher for Taking the Online AP® Exam
- Celebrate National Robotics Week With Supervised Teardowns
- AP® Statistics: 6 Math Functions You Must Know for the TI-84 Plus
- May (1)
- June (3)
- July (2)
- August (5)
- September (2)
-
October (4)
- Transformation Graphing — the Families of Functions Modular Video Series to the Rescue!
- Top 3 Halloween-Themed Classroom Activities
- In Honor of National Chemistry Week, 5 “Organic” Ways to Incorporate TI Technology Into Chemistry Class
- 5 Spook-tacular Ways to Bring the Halloween “Spirits” Into Your Classroom
- November (4)
- December (1)
- 2020
- 2019
-
2018
- January (1)
- February (5)
- March (4)
- April (5)
- May (4)
- June (4)
- July (4)
- August (4)
- September (5)
- October (8)
-
November (8)
- Testing Tips: Using Calculators on Class Assessments
- Girls in STEM: A Personal Perspective
- 5 Teachers You Should Be Following on Instagram Right Now
- Meet TI Teacher of the Month: Katie England
- End-of-Marking Period Feedback Is a Two-Way Street
- #NCTMregionals Kansas City 2018 Recap
- Slope: It Shouldn’t Just Be a Formula
- Hit a high note exploring the math behind music
- December (5)
- 2017
- 2016
- 2015