Lesson 13.4: TI-84 Minimum and Maximum Feature
The TI-84 has features in the CALCULATE menu that approximate maximums and minimums. In this lesson you will use these features and compare results with local extrema found in previous lessons. Although these features are usually quite accurate, you should remember they give numerical approximations, not exact values.
In Lesson 13.2 and Lesson 13.3 you found local extrema of f(x) = x3 - 2x - 2cosx using first and second derivatives. The Minimum and Maximum features in the CALCULATE menu can also be used to approximate the local extrema.
- Set Y1= X^3 - 2X - 2 cos(X).
- Display the graph in a [-3, 3, 1] x [-5, 5,1] window.
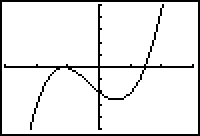
Use the calculator's Minimum feature to approximate the coordinates of the local minimum shown on the graph.
-
Open the Graph screen's CALCULATE menu by pressing
 [CALC].
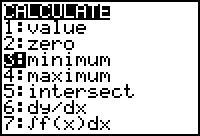
- Select 3:minimum.
The calculator returns to the graph and prompts you for a left bound.
- Move the cursor until it is slightly to the left of the minimum.
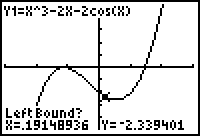
-
Select the left bound by pressing

The calculator now prompts you for a right bound.
- Move the cursor until it is just to the right of the minimum.
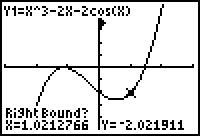
-
Select the right bound by pressing
 .
.
The calculator prompts you for an initial guess for the minimum.
- Move the cursor close to the minimum.
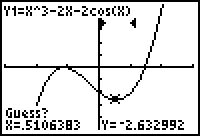
-
Provide an initial guess by pressing
 .
.
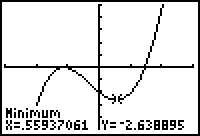
The calculator improves on the initial guess and returns an approximation of the coordinates of the local minimum point: (0.559, -2.639). The coordinates of the local minimum are very close to those found in previous lessons.
The Maximum feature of the CALCULATE menu can be used to find a local maximum using a similar procedure.
13.4.1 Use the Maximum feature and the procedure described above to find the coordinates of the local maximum of f(x) = x shown in the graph above. Click here for the answer.
Approximating Another Minimum Value
This last example is a reminder that minimum and maximum values produced by a calculator are not exact. Use the calculator's Minimum feature to approximate the minimum of f(x) = x2.
- Graph Y1 = X2 in a [-3, 3, 1] x [-5, 5, 1] window.
- Use the Minimum feature in the CALCULATE menu to find the local minimum. Leaving the cursor away from (0,0) for your initial guess.
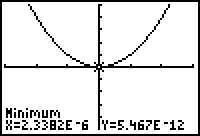
The calculator provides approximations that are given in exponential notation, and although these approximations are quite close, they are not exact. (Your calculator may provide slightly different values.) The exact coordinates of the minimum point of this parabola are (0,0).
The coordinates given by the Minimum and Maximum features of the CALCULATE menu depend on the bounds and on the initial guess. Selecting different bounds and/or initial guesses may produce slightly different approximations of the minimum or maximum values. While both are approximations, in general, the y-coordinate will be more accurate than the x-coordinate.
