
Get the latest update for your
TI-Nspire™ CX software.
TI-Nspire™ CX Student Software
Powerful computer software that satisfies math and science curriculum needs from middle school through college.
Powerful computer software that satisfies math and science curriculum needs from middle school through college.
| Calculator
Perform calculations in proper math notation. |
Lists & Spreadsheet
Combine spreadsheet functionality with mathematical operations. |
||
| Graphs
Plot, explore and animate functions, equations and inequalities. |
Data & Statistics
Dynamic graphing and interactive analysis of data. |
||
| Geometry
Construct and explore dynamically geometric figures and properties. |
Notes
Create interactive activities, documents or reports. |
||
| DataQuest™
Plug and play data collection and scientific analysis. |
Programming
Add new functionality and create rich STEM activities with Python and TI-Basic coding languages. |
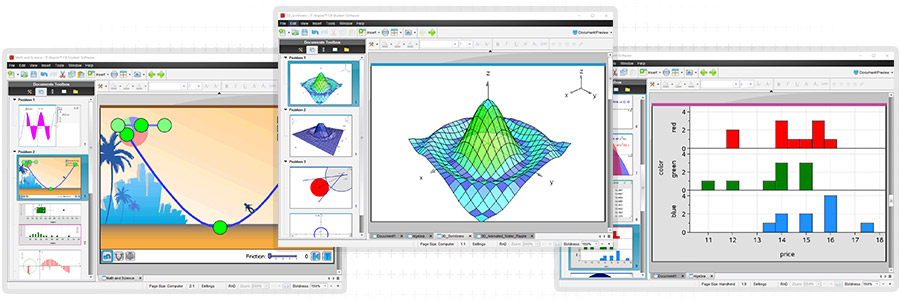
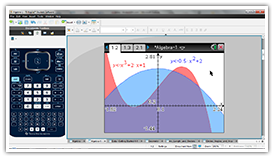
View multiple representations at the
same time and recognize updates to representations as things change mathematically; promote conceptual understanding regardless of students’ individual learning styles.
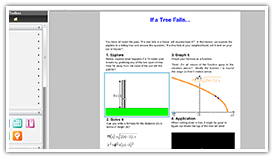
Use the PublishView™ feature to add
TI-Nspire™ applications, rich text, hyperlinks, images or videos and create interactive worksheets, lab reports and homework assignments.
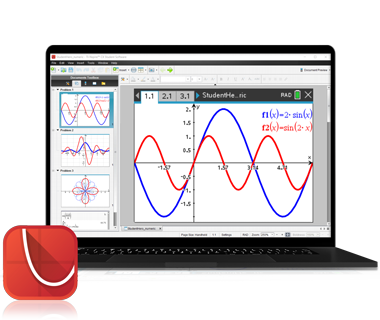
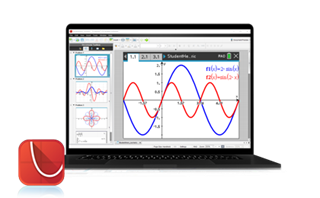
In addition to the normal computer view, you can also work on documents in the special handheld view, which shows documents as they appear on the TI-Nspire™ CX graphing calculator display.
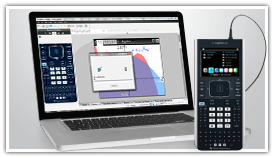
Students can easily transfer work between their TI-Nspire™ CX graphing calculator and computer to complete work outside of school, at home or at the library.
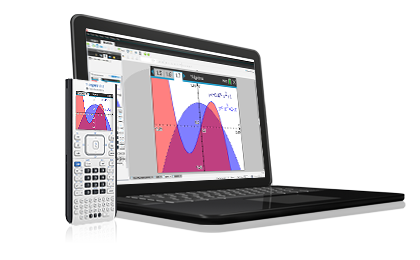
Take home TI-Nspire™ CX Student Software and the
TI-Nspire™ CX II graphing calculator together in a single package. Make an
all-in-one purchase at your retailer.
Vernier DataQuest™ is a trademark of Vernier Software & Technology.
*macOS 27 is the last release with full Rosetta 2 support. TI software using Rosetta 2 may not run on macOS 28 or newer.
Compatible with:
Mac, Rosetta are trademarks of Apple Inc., registered in the U.S. and other countries. Vernier EasyLink and Vernier EasyTemp are registered trademarks of Vernier Software & Technology. Intel and Windows are registered trademarks of their respective owners.
Take advantage of TI’s comprehensive suite of free activities and services for your computer software.