
Solution 40497: Calculating and Graphing a Linear Regression on the TI-84 Evo.
How do I calculate and graph a linear regression on the TI-84 Evo?
The following example will demonstrate how to calculate a linear regression.First, you will need to enter the data:
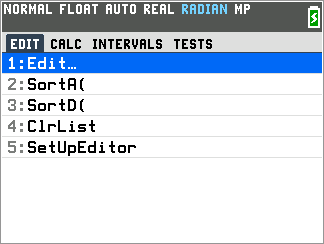
• Press [STAT] [1] to enter the Stat List Editor.
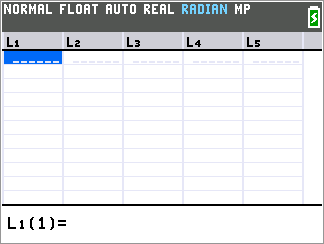
• Enter the data {3,5,8,10,15} in the L1 list and {7,8,12,14,17} in the L2 list, pressing [ENTER] after each entry to move down along the list.
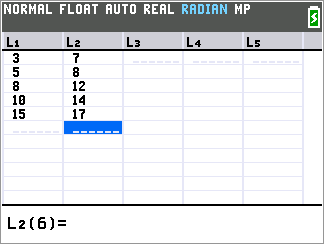
To calculate the Linear Regression (ax+b):
• Press [STAT] to enter the statistics menu.
• Press the right arrow key to reach the CALC menu and then press 4: LinReg(ax+b).
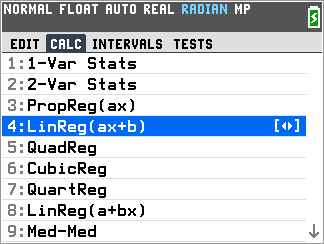
• Ensure XLIST is set at L1, YLIST is set at L2 and Store RegEQ is set at Y1 by pressing [alpha] then [trace] followed by [1] to select 1:Y1.
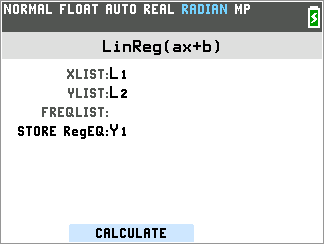
• Press [Window] or [Zoom] to select CALCULATE.
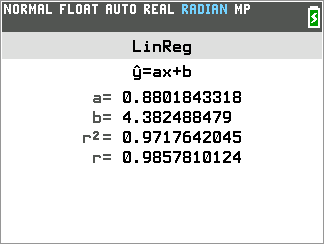
The graphing calculator will display the form of the equation as (y=a+bx) and list the values for the two coefficients (a and b). It will store the regression equation to your Y1 function. The correlation coefficient (r and r^2) will be displayed.
In order to graph the data:
• Press [2ND] [STAT PLOT] to enter the stat plot menu.
• Press [1] to enter plot 1.
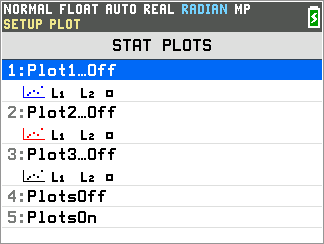
• Highlight ON and press [ENTER] to turn the stat plot on and be sure that Xlist is L1 and Ylist is L2.
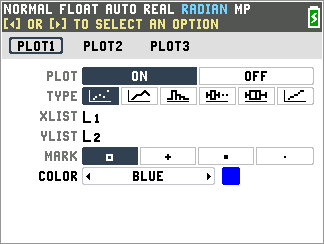
• Press [GRAPH].
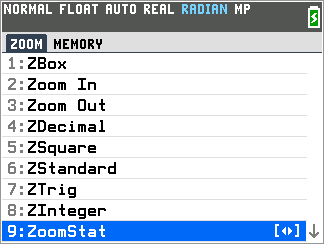
• Press [ZOOM] [9] to select ZoomStat.
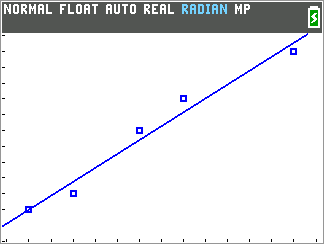
• Your graph screen will display the following:
Please see the TI-84 Evo User Guide for additional information.