Big Data Sets - CO2 Levels

Big Data Sets - CO2 Levels
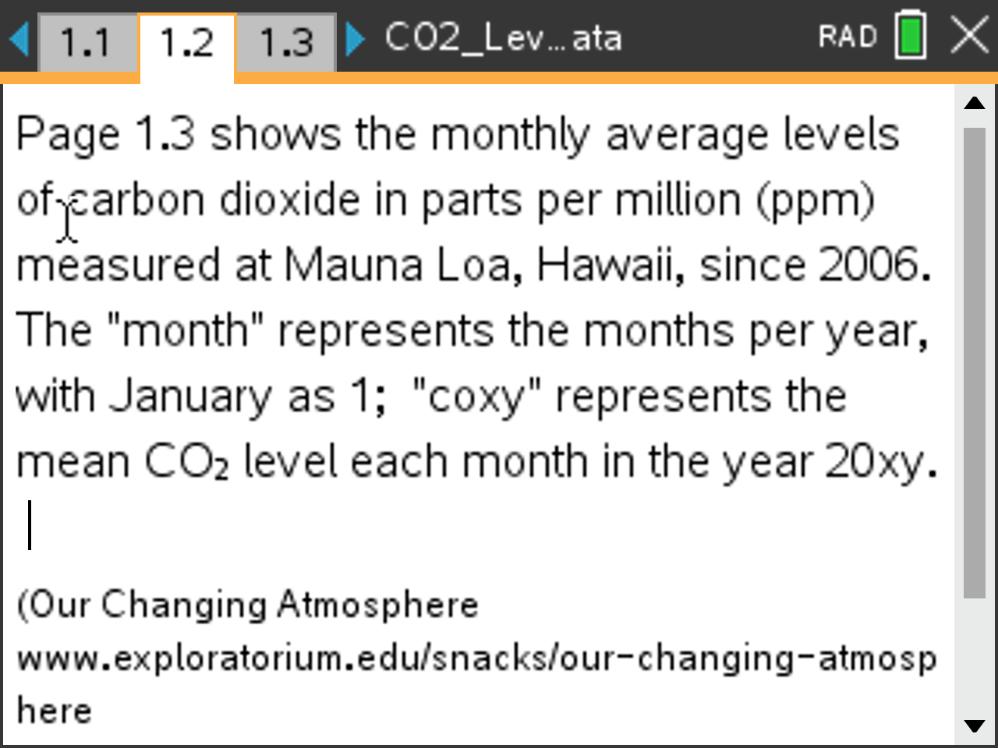
Students can explore the data of the monthly mean amounts of carbon dioxide in the atmosphere measured in parts per million at Mauna Loa Observatory, Hawaii from 1958 to 2022.
Giving students large data sets can be a challenging and motivating experience. These data are the monthly mean amounts of carbon dioxide in the atmosphere measured in parts per million at Mauna Loa Observatory, Hawaii from 1958 to 2022. The monthly averages are based on daily averages, which are compiled from hourly averages. For more information see NOAA . Note that there is also an introductory activity, Modeling CO2 Levels, that investigates just the data from 2006 using the data in Table 1. This is activity is available in the Prediction section of the Mathematical Modeling activities and could be used as a starting point before examining the trend beginning in 1958.
"Exploring Big Data Sets Guide" provides guidance on using the data sets to engage students in the data science process using a recommended structure.
Lesson Files
Vernier EasyData,Vernier EasyLink and Vernier EasyTemp are registered trademarks of Vernier Science Education.

