
Polar Necessities
Math: Calculus: Parametric Equations and Polar Coordinates
Math: Calculus: Applications of the Derivative
Math: Precalculus: Polar Equations
Math: AP Calculus: AP Calculus
9-12
15 Minutes
TI-89 / TI-89 Titanium
Lessons
Polar Necessities
Activity Overview
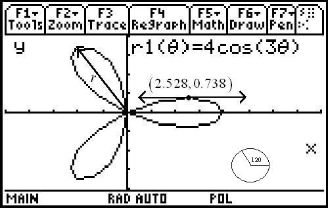
Students will graphically and algebraically find the slope of the tangent line at a point on a polar graph. Finding the area of a region of a polar curve will be determined using the area formula.
Download Files
Teacher Files
Student Files
Math: Calculus: Parametric Equations and Polar Coordinates
Math: Calculus: Applications of the Derivative
Math: Precalculus: Polar Equations
Math: AP Calculus: AP Calculus
9-12
15 Minutes
TI-89 / TI-89 Titanium
Lessons
iPad is a trademark of Apple Inc., registered in the U.S. and other countries.
Vernier EasyData,Vernier EasyLink and Vernier EasyTemp are registered trademarks of Vernier Science Education.
Vernier EasyData,Vernier EasyLink and Vernier EasyTemp are registered trademarks of Vernier Science Education.