
Regressions of Olympic Proportions
Math: Middle Grades Math: Statistics and Probability
6-8
45 Minutes
TI Connect™
TI-84 series
Lessons
Regressions of Olympic Proportions
Activity Overview
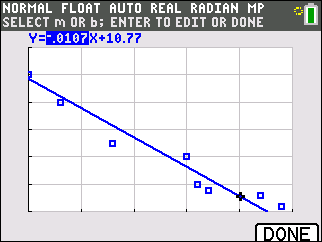
Students use the Manual-Fit and Linear Regression commands to find lines of best fit to model Olympic data.
Download Files
Teacher Files
Student Files
Math: Middle Grades Math: Statistics and Probability
6-8
45 Minutes
TI Connect™
TI-84 series
Lessons
iPad is a trademark of Apple Inc., registered in the U.S. and other countries.
Vernier EasyData,Vernier EasyLink and Vernier EasyTemp are registered trademarks of Vernier Science Education.
Vernier EasyData,Vernier EasyLink and Vernier EasyTemp are registered trademarks of Vernier Science Education.