
Chi-Squared Tests
Math: Statistics: Sampling Distributions
9-12
50 Minutes
TI-84 series
Lessons
Chi-Squared Tests
Activity Overview
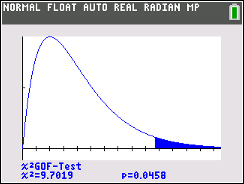
In this activity, students will look at a problem situation that involves categorical data and will determine which is the appropriate chi-square test to use: the chi-squared goodness of fit or the chi-squared two-way test.
Objectives
- Students will recognize that chi-squared tests are for counts of categorical data.
- Students will identify the appropriate chi-squared test to use for a given situation: Goodness of Fit Test, Test of Independence, or Test of Homogeneity.
- Students will learn how to calculate the degrees of freedom for each type of chi-squared test.
- Students will interpret the results of a chi-square test.
- Students will reason abstractly and quantitatively.
Vocabulary
- goodness-of-fit
- categorical data
- observed counts
- p-value
- degrees of freedom
- test of homogeneity
- expected counts
- test of independence
About the Lesson
This lesson involves investigating chi-squared tests and distributions. Students will compare different scenarios and determine which chi-square test is appropriate. They will look at chi-square test results and make the correct decision to reject or fail to reject the null hypothesis and write their conclusions in context.
Download Files
Teacher Files
Student Files
Math: Statistics: Sampling Distributions
9-12
50 Minutes
TI-84 series
Lessons
iPad is a trademark of Apple Inc., registered in the U.S. and other countries.
Vernier EasyData,Vernier EasyLink and Vernier EasyTemp are registered trademarks of Vernier Science Education.
Vernier EasyData,Vernier EasyLink and Vernier EasyTemp are registered trademarks of Vernier Science Education.