
What's Normal, Anyway?
Math: Statistics: Data Analysis
Math: Statistics: Normal Distributions
9-12
60 Minutes
TI-84 series
Lessons
What's Normal, Anyway?
Activity Overview
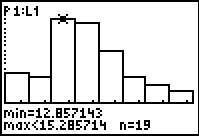
Students explore normal distribution and several properties. First, simulate a binomial experiment and use a histogram of the data to examine the general shape of a normal curve. They graph a normal distribution given the mean and standard deviation. They see how the graph changes when just the mean or standard deviation changes. Lastly, they further examine normal distributions, describing the percent of data values falling within different standard deviations from the mean.
Download Files
Teacher Files
Student Files
Math: Statistics: Data Analysis
Math: Statistics: Normal Distributions
9-12
60 Minutes
TI-84 series
Lessons
iPad is a trademark of Apple Inc., registered in the U.S. and other countries.
Vernier EasyData,Vernier EasyLink and Vernier EasyTemp are registered trademarks of Vernier Science Education.
Vernier EasyData,Vernier EasyLink and Vernier EasyTemp are registered trademarks of Vernier Science Education.