
Scatterplot Pulse Rates
Math: Statistics: Describing Bivariate Data
9-12
50 Minutes
TI-Nspire™ CX series
TI-Nspire™ CX CAS/CX II CAS
TI-Nspire™ Apps for iPad®
3.6
Scatterplot Pulse Rates
Activity Overview
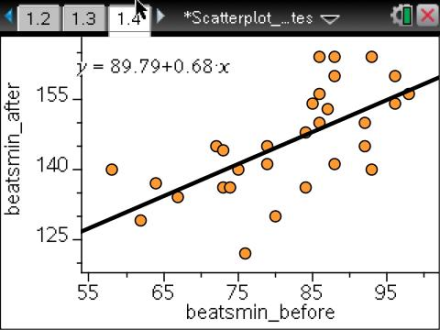
This lesson involves creating a scatterplot and fitting a line to student pulse rates collected before and after exercise.
Objectives
- Students will analyze the relationship between two quantities by plotting data on a scatterplot.
- Students will informally assess the fit of a function by plotting and analyzing residuals.
- Students will recognize that, if a linear model is a good fit for the data, the residual plot should not have a pattern or be systematic in any way.
- Students will analyze and interpret the significance of the slope and y-intercept of a linear model.
Vocabulary
- explanatory variable
- least-squares regression line
- residual
- response variable
- scatter plot
- slope
About the Lesson
This lesson involves creating a scatterplot and fitting a line to student pulse rates collected before and after exercise.
As a result, students will:
- Fit a moveable line to a scatterplot of pulse rates before and after exercise.
- Identify large residuals from the scatterplot and line and from the residual plot.
- Drag the line, and observe how the residuals change.
- Inspect the least-squares regression line and the corresponding residual plot.
Download Files
Math: Statistics: Describing Bivariate Data
9-12
50 Minutes
TI-Nspire™ CX series
TI-Nspire™ CX CAS/CX II CAS
TI-Nspire™ Apps for iPad®
3.6
iPad is a trademark of Apple Inc., registered in the U.S. and other countries.
Vernier EasyData,Vernier EasyLink and Vernier EasyTemp are registered trademarks of Vernier Science Education.
Vernier EasyData,Vernier EasyLink and Vernier EasyTemp are registered trademarks of Vernier Science Education.