

Exploring Points of Interest on a Function Graph
Exploring Points of Interest on a Function Graph
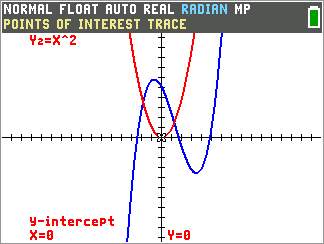
In this activity, students explore Points of Interest (POI) on function graphs using the TI-84 Evo's built-in Detect POI trace feature. Starting with key graphical features — zeros, y-intercepts, maxima, minima, and intersections — students use the POI trace tool to identify these features dynamically as they trace along function graphs. The activity then extends into calculus, where students investigate the relationships between a function's points of interest and those of its first and second derivatives.
This lesson connects graphical analysis with core calculus concepts. After building foundational understanding through guided examples, students analyze the relationships between a function and its derivatives, exploring whether critical values correspond to maxima or minima and whether zeros of the second derivative indicate inflection points. Through carefully chosen problems, students develop the critical thinking skills needed to recognize when these relationships hold and when they do not.

Vernier EasyData,Vernier EasyLink and Vernier EasyTemp are registered trademarks of Vernier Science Education.