
Best Class
Math: Statistics: Displaying and Describing Univariate Data
Math: Statistics: Data Analysis
Math: IB: Analysis-Approaches
Math: IB: Applications-Interpretations
9-12
50 Minutes
TI-Nspire™ CX series
TI-Nspire™ CX CAS/CX II CAS
5.4
Lessons
TNS
Best Class
Activity Overview
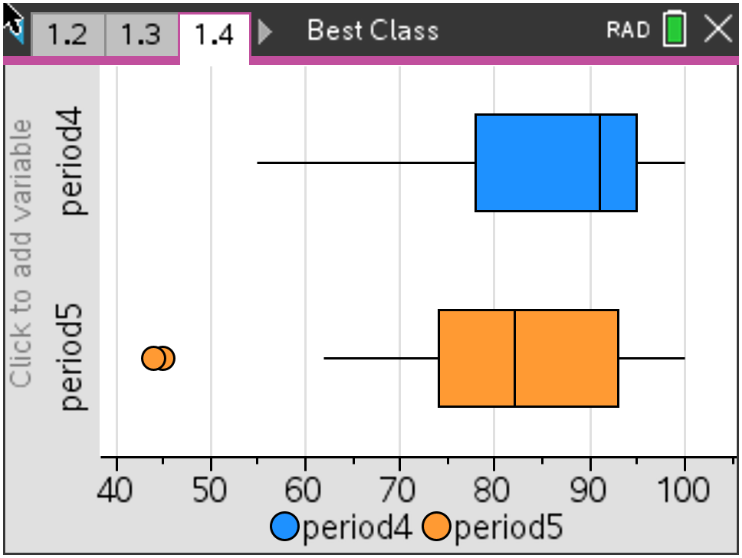
In this activity, students create and explore a box and whisker diagram and histogram for a data set. They then compare the two data displays by viewing them together and use the comparison to draw conclusions about the data.
Objectives
- Students will represent real-world data using a histogram and box and whisker diagram.
- Students will calculate measures of central tendency and spread.
- Students will compare distributions from two data sets and draw conclusions.
- Students will identify and analyze outliers in a data set.
Vocabulary
- Histogram
- Outlier
- Box and Whisker Diagram
- Skew
- Median
- Interquartile Range
About the Lesson
Students are given the results from a recent test. They will need to display the data graphically and will refresh their understanding of histograms and box and whisker diagrams.
*Note: This activity includes optional IB support, including an IB Question download for students who are preparing for the IB Exam.
Download Files
Math: Statistics: Displaying and Describing Univariate Data
Math: Statistics: Data Analysis
Math: IB: Analysis-Approaches
Math: IB: Applications-Interpretations
9-12
50 Minutes
TI-Nspire™ CX series
TI-Nspire™ CX CAS/CX II CAS
5.4
Lessons
TNS
iPad is a trademark of Apple Inc., registered in the U.S. and other countries.
Vernier EasyData,Vernier EasyLink and Vernier EasyTemp are registered trademarks of Vernier Science Education.
Vernier EasyData,Vernier EasyLink and Vernier EasyTemp are registered trademarks of Vernier Science Education.