Solution 34602: Graphing a Step Function on the TI-83 Plus and TI-84 Plus Family of Graphing Calculators.
How can I graph a step function on the TI-83 Plus and TI-84 Plus family of graphing calculators?
A step function (for example, the greatest integer function) can be graphed by using the int( command. The example below will demonstrate how to graph a step function.
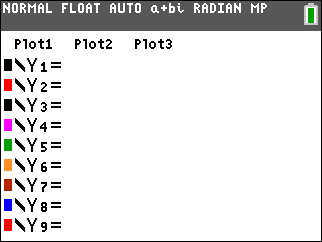
Example: Graph the greatest integer of Y=X1) Press [Y=] to access the Y Editor
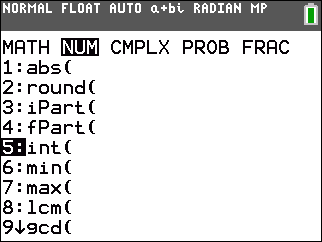
2) Press [math] then [→] to select the NUM menu
3) Press [5] to select 5:int(
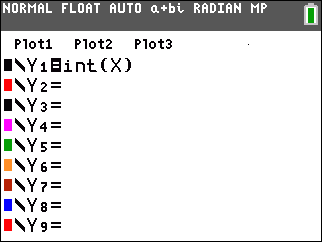
4) Press [X,T,θ,n] to input the X variable then [ ) ] to complete the command
5) Press the [zoom] then [5] to select 5:ZStandard to set default window settings and display the graph.
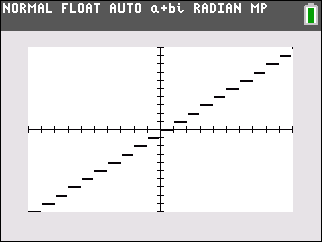
Please Note: The TI-83 Plus Family will display the above graph connected. To make it appear dashed as above press [Y=] followed by [←] [←] then [enter] 6 times to select the Line Style "DOT" which appears as a dotted line. Once this is done you can press [Graph] to view the graph as listed above.
Please see the TI-83 Plus and TI-84 Plus Family guidebooks for additional information.
Last updated: 7/25/2023