
Slope - Confidence Interval and Hypothesis Test
Math: Statistics: Confidence Intervals
9-12
45 Minutes
TI-Nspire™ CX series
TI-Nspire™ CX CAS/CX II CAS
3.0
Lessons
TNS
Slope - Confidence Interval and Hypothesis Test
Activity Overview
This lesson involves investigating the confidence interval and hypothesis test for the slope of a regression line.
Objectives
- Students will be able to identify the conditions that need to be met to perform inference procedures for the slope of a regression line.
- Students will be able to interpret the results of a hypothesis test for slope and write the conclusion in context.
- Students will be able to calculate the degrees of freedom for inference procedures on bivariate data.
- Students will be able to interpret a confidence interval for the slope in context.
Vocabulary
- bivariate data
- confidence interval
- degrees of freedom
- hypothesis test for slope
- least-squares regression
- normal probability plot
- p-value
- residual
- scatterplot
- slope
About the Lesson
This lesson involves investigating the confidence interval and hypothesis test for the slope of a regression line.
As a result, students will:
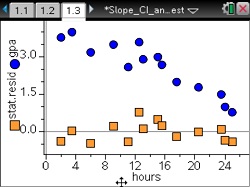
- Check the conditions for inference for slope by inspecting a scatterplot of the data, the normal probability plot, and a plot of the residuals.
- Write the appropriate null and alternative hypotheses for the given scenario, determine the degrees of freedom for the data, and interpret the results of a hypothesis test for the slope.
- Analyze the results of a hypothesis test performed on the TI-Nspire, make a decision to reject or fail to reject the null hypothesis, and write their conclusion in the context of the situation.
- Calculate and interpret a confidence interval in context.
- Compare the information they get about the relationship from a hypothesis test and from a confidence interval.
Math: Statistics: Confidence Intervals
9-12
45 Minutes
TI-Nspire™ CX series
TI-Nspire™ CX CAS/CX II CAS
3.0
Lessons
TNS
iPad is a trademark of Apple Inc., registered in the U.S. and other countries.
Vernier EasyData,Vernier EasyLink and Vernier EasyTemp are registered trademarks of Vernier Science Education.
Vernier EasyData,Vernier EasyLink and Vernier EasyTemp are registered trademarks of Vernier Science Education.