
Say It With a Survey
Math: Middle Grades Math: Statistics and Probability
6-8
45 Minutes
TI-Nspire™ CX series
TI-Nspire™ CX CAS/CX II CAS
TI-Nspire™ Apps for iPad®
3.6
Lessons
TNS
Say It With a Survey
Activity Overview
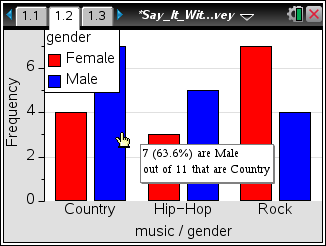
This lesson involves using given bivariate and multivariate categorical data to display bar charts and construct two-way tables.
Objectives
- Students will represent bivariate categorical data with bar charts and split bar charts.
- Students will examine and describe patterns in bivariate categorical data by displaying frequencies in a two-way table.
- Students will use relative frequencies to identify a possible association between the two variables.
Vocabulary
- bivariate data
- categorical data
- split bar chart
- two-way tables
About the Lesson
This lesson involves using given bivariate and multivariate categorical data to display bar charts and construct two-way tables.
As a result, students will:
- Construct bar charts and split bar charts for categorical data.
- Build tables and two-way tables by gathering information in the charts.
- Find any patterns of association in the charts or tables.
Download Files
Math: Middle Grades Math: Statistics and Probability
6-8
45 Minutes
TI-Nspire™ CX series
TI-Nspire™ CX CAS/CX II CAS
TI-Nspire™ Apps for iPad®
3.6
Lessons
TNS
iPad is a trademark of Apple Inc., registered in the U.S. and other countries.
Vernier EasyData,Vernier EasyLink and Vernier EasyTemp are registered trademarks of Vernier Science Education.
Vernier EasyData,Vernier EasyLink and Vernier EasyTemp are registered trademarks of Vernier Science Education.