Sampling Distributions

Sampling Distributions
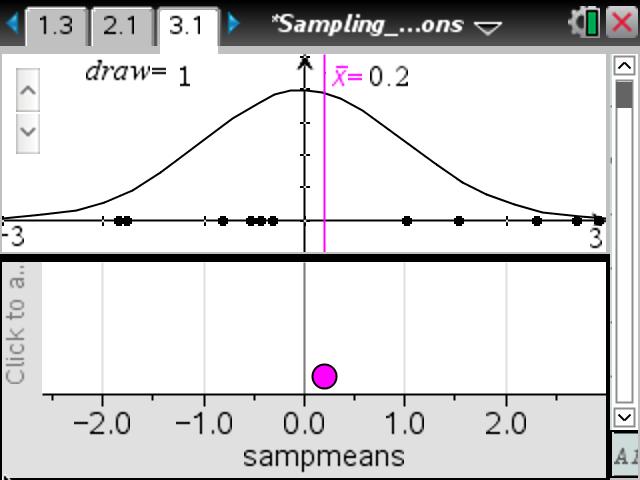
This lesson involves examining samples from a normal population and observing the distribution of the means of those samples.
- Students will recognize that the means of different samples from a normal population will vary symmetrically around the mean of the population, with values near the mean occurring more frequently than those further from the mean, but in a narrower interval than that of individual elements of the population.
- Students will recognize that as sample size increases, variability (spread) in the sampling distribution of sample means decreases.
• dot plot
• histogram
• mean
• normal distribution
• population
• sample
• sample mean
• sampling distribution
• standard deviation
Note that this lesson is not about establishing the central limit theorem but rather is focused on helping students understand what a sampling distribution is. This would be a good activity prior to introducing the central limit theorem.
This lesson involves examining samples from a normal population and observing the distribution of the means of those samples.
As a result, students will understand that the sample mean varies from sample to sample, having its own distribution.
- Understand that the sample mean varies from sample to sample, having its own distribution.
- Estimate descriptive measures for the sampling distribution, and use those measures to approximate the simulated sampling distribution by selecting the mean and standard deviation for overlaying a normal curve.
Vernier EasyData,Vernier EasyLink and Vernier EasyTemp are registered trademarks of Vernier Science Education.

