
Multiple Boxplots
Math: Statistics: Displaying and Describing Univariate Data
9-12
45 Minutes
TI-Nspire™ CX series
TI-Nspire™ CX CAS/CX II CAS
3.0
Lessons
TNS
Multiple Boxplots
Activity Overview
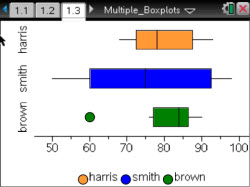
This lesson involves analyzing three parallel boxplots.
Objectives
- Students will interpret comparative boxplots.
Vocabulary
- boxplot
- five-number summary
- interquartile range
- maximum
- mean
- median
- minimum
- outlier
- Q1 (lower quartile) and Q3 (upper quartile)
About the Lesson
This lesson involves analyzing three parallel boxplots.
As a result, students will:
- Make conjectures about the distribution of grades for three students.
- Compare the distribution of grades for the three students using information obtained from the boxlplots.
Math: Statistics: Displaying and Describing Univariate Data
9-12
45 Minutes
TI-Nspire™ CX series
TI-Nspire™ CX CAS/CX II CAS
3.0
Lessons
TNS
iPad is a trademark of Apple Inc., registered in the U.S. and other countries.
Vernier EasyData,Vernier EasyLink and Vernier EasyTemp are registered trademarks of Vernier Science Education.
Vernier EasyData,Vernier EasyLink and Vernier EasyTemp are registered trademarks of Vernier Science Education.