Knowledge Base
Solution 24493: Missing Graph Lines When Graphing a Family Functions on the TI-Nspire™ Family Products.
Why am I missing lines when graphing a family functions on the TI-Nspire family products?
The TI-Nspire family is limited on the amount of numbers that can be displayed in a family of functions to 16. In order to graph more then this it is necessary to create another function below it with the additional family of functions you wish to display that exceed 16.For example, trying to graph the following family of functions will show only 16 lines: f(x)=seq(a*x+1,a,1,20)
If entered into the calculator like it is written above, the calculator would disregard 17x+1, 18x+1, 19x+1 and 20x+1. To graph all the functions, break up the family of functions as follows:
• Press [home].
• Press [ctrl] [+page].
• Press 2: Add Graphs to add a Graphs App.
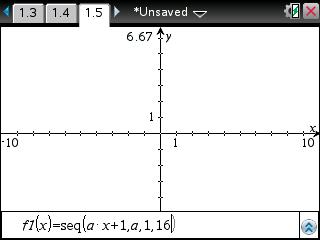
• Press [S] [E] [Q] [(] [A] [*] [X] [+] [1] [,] [A] [,] [1] [,] [1] [6].
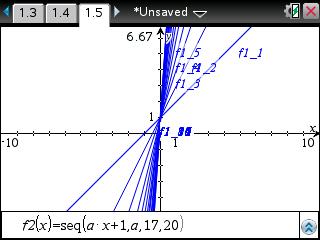
• Press the down arrow.
• Press [S] [E] [Q] [(] [A] [*] [X] [+] [1] [,] [A] [,] [1] [7] [,] [2] [0].
• Press [enter].
• Press [menu].
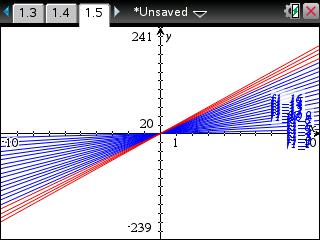
• Press 4: Window/Zoom to view all functions with the appropriate window settings.
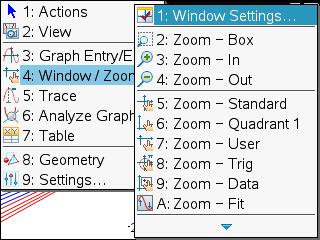
• Press A: Zoom - Fit.
Please see the TI-Nspire family guidebooks for additional information.