Solution 34846: Graphing a Normal PDF Function and Displaying the Normal Distribution Curve on the TI-83 Plus and TI-84 Plus Family of Graphing Calculators.
How do I graph a Normal PDF function and have the Normal Distribution curve display correctly on the TI-83 Plus and TI-84 Plus Family of Graphing Calculators?
To graph a Normal PDF function and have the Normal Distribution curve display correctly, follow the WINDOW settings guidelines and example listed below.WINDOW settings guidelines:
1) The Xmin value should be the "Mean" or "Average" value minus 3 or 4 times the "Standard Deviation" value. When using 3 times the Standard Deviation, the Normal Distribution curve will be graphed, however, the "tails" of the graph will not be displayed. When using 4 times the Standard Deviation, the Normal Distribution curve will be graphed and the "tails" of the graph will be displayed.
2) The Xmax value should be the "Mean" or "Average" value plus 3 or 4 times the "Standard Deviation" value. When using 3 times the Standard Deviation, the Normal Distribution curve will be graphed, however, the "tails" of the graph will not be displayed. When using 4 times the Standard Deviation, the Normal Distribution curve will be graphed and the "tails" of the graph will be displayed.
3) The Xscl value should be the Standard Deviation value.
4) The Ymin, Ymax and Yscl values should be set to default (see below). These values will be changed later using the "ZoomFit" function.
Ymin = -10
Ymax = 10
Yscl = 1
Example: Graph a Normal Distribution curve where the Mean (Average) is 800 and the Standard Deviation is 40 by following the steps below.
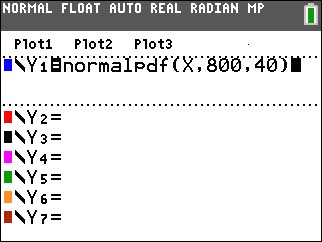
1) Press the [Y=] key and clear any previous functions by pressing [CLEAR].
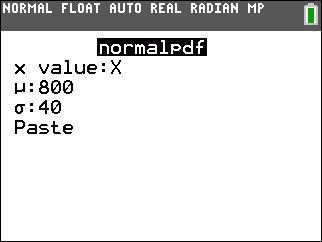
2) For Y1, input normalpdf(x,800,40).
Please Note: To access the normalpdf function, press [2nd] [VARS] [1]. If you have Stat Wizards enabled (TI-84 Plus Family of Graphing Calculators Only), you will see a menu prompting for the values. Enter the values, highlight "Paste" and press [ENTER].
3) Press the [WINDOW] key.
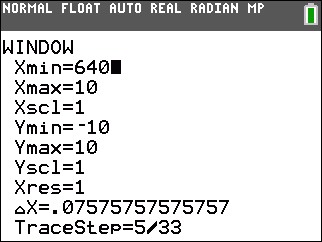
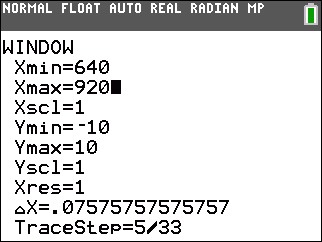
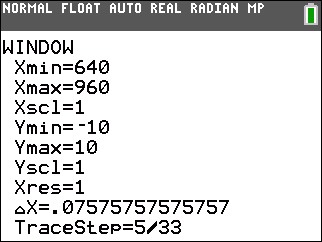
4) For Xmin, input 680 (Mean minus 3 times the Standard Deviation). This will display the graph without "tails". To see the graph with "tails", input 640 (Mean minus 4 times the Standard Deviation).
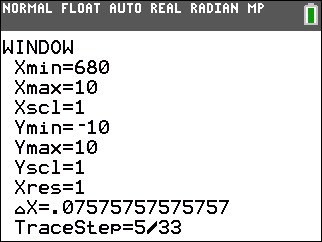
5) For Xmax, input 920 (Mean plus 3 times the Standard Deviation). This will display the graph without "tails". To see the graph with "tails", input 960 (Mean plus 4 times the Standard Deviation).
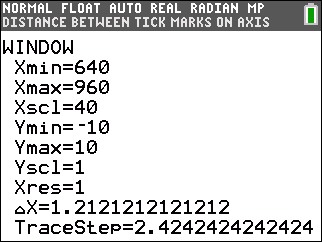
6) For Xscl, input 40 (Standard Deviation).
7) For Ymin, Ymax, and Yscl, input the default values of -10, 10 and 1 respectively. If these values are already present, disregard this step.
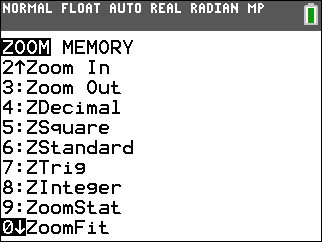
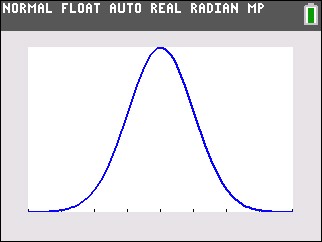
8) Press [ZOOM] [0] to perform a "ZoomFit". Based on the method used, the graph will be displayed with or without "tails".
Please see the TI-83 Plus and TI-84 Plus Family guidebooks for additional information.