Solution 30651: Calculating a Median-Median Regression on the TI-83 Plus Family of Graphing Calculators.
How do I calculate a Median-Median Regression on the TI-83 Plus family of graphing calculators?
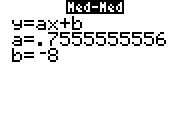
Med-Med (median-median) fits the model equation y=ax+b to the data using the median-median line (resistant line) technique, calculating the summary points x1,y1,x2,y2,x3 and y3. Med-Med displays values for a (Slope) and b (y-intercept).The following example will demonstrate how to calculate a Med-Med regression:
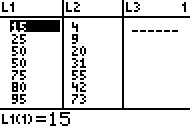
X= {15; 25; 50; 50; 75; 80; 95}
Y= {4; 9; 20; 31; 55; 42; 73}
Key the data into the handheld:
1) Enter STAT edit mode by pressing [STAT], [1].
2) Enter the data in the L1 and L2 lists, pressing [ENTER] after each entry.
3) Press [2nd] [QUIT] to leave the editor.
To calculate the Med-Med line, please follow the steps below:
1) Press [STAT] then the [Right Arrow] to select CALC.
2) Press [3] to select Med-Med.
3) Press [2nd] [1] [,] [2nd] [2] [,] [Vars] [Right Arrow] to select Y-Vars [1] [1] [Enter] to perform the regression calculation and store the regression equation to Y1.
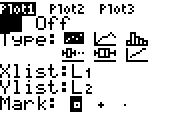
To set up the Stat Plot, please follow the steps below:
1) Press [2nd] [STAT PLOT].
2) Choose [1:Plot1].
3) Select ON and press [ENTER].
4) Select Scatter Plots and press [ENTER].
5) Make Xlist = L1 and Ylist = L2.
Please Note: Mark may be set to the first setting.
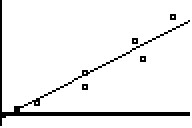
To graph the linear regression, please follow the steps below:
1) Press [Y=] the cursor should be beside Y1=.
2) Press [VARS] down to [5:] Statistics [ENTER].
3) Scroll to EQ press [1: RegEQ].
4) Press [GRAPH].
5) Press [ZOOM] and select [ZOOMSTAT] and press [ENTER].
Please see the TI-83 Plus guidebooks for additional information.