Solution 33931: Calculating and Graphing a Quadratic Regression on the TI-Nspire™ Family Products.
How do I calculate and graph a quadratic regression on the TI-Nspire Family Products?
The following example will demonstrate how to calculate and graph a quadratic regression:
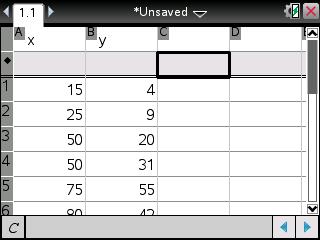
x= {15; 25; 50; 50; 75; 80; 95}
y= {4; 9; 20; 31; 55; 42; 73}
To enter the data:
1) Press [home], select List & Spreadsheet, and press [enter].
2) Enter the data in Column A and Column B, pressing [enter] after each entry.
3) Press the up arrow until you highlight cell A.
4) Input [x] to name Column A and press [enter].
5) Press the arrow until you highlight cell B.
6) Input [y] to name Column B and press [enter].
7) Press the right arrow once to get to an empty cell.
8) Press [menu].
9) Select 4: Statistics.
10) Select 1: Stat Calculations.
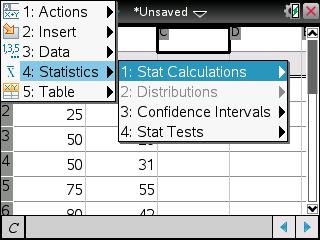
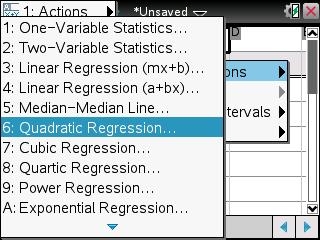
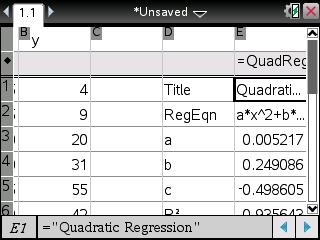
11) Select 6: Quadratic Regression.
12) Press the right arrow until you highlight 'x and press [tab].
13) Press the right arrow again to highlight 'y and press [tab] to save the equation into [f1].
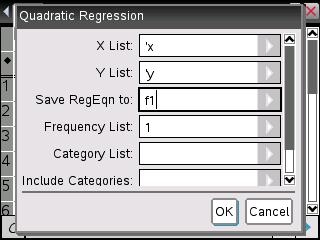
14) Press [enter] to get the result of the quadratic regression.
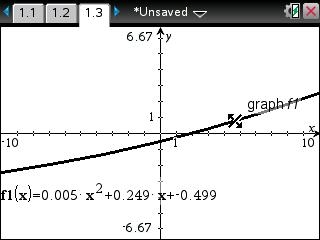
To graph the regression:
1) Press [home] and select Graphs
Please Note: If you do not see f1(x)=, press the down arrow until you see f1(x)= with the equation to be graphed.
2) Press [enter] to see the graph or you can use Window/zoom and Zoom-Data to change the graph view.
Please see the TI-Nspire family guidebooks for additional information.