Solution 34494: Creating a Scatter Plot Using the TI-84 Plus C Silver Edition.
How can I create a scatter plot using the TI-84 Plus C Silver Edition?
The following example will demonstrate how to enter statistical data and graph a scatter plot using the TI-84 Plus C Silver Edition.
Data for this example:
L1: {7,2,4,2,5}
L2: {8,4,6,2,7}
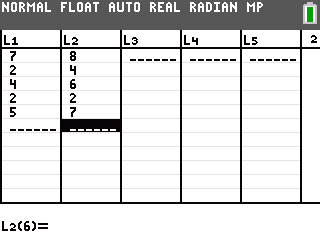
To input data into the STAT list editor:
1) Enter STAT edit mode by pressing [STAT] [1].
2) Enter the data in the L1 and L2 lists, pressing [ENTER] after each entry.
3) Press [2nd] [QUIT] to quit and return to the home screen.
Graph the scatter plot:
1) Press [2nd] [STAT PLOT] to access the STAT PLOT editor.
2) Press [ENTER] to edit Plot1.
3) Press [ENTER] to turn ON Plot1.
4) Scroll down to Type and press [ENTER] to select the scatter plot graph type.
5) Scroll down and make sure Xlist: is set to L1 and Ylist: is set to L2. To input L1, press [2ND] [L1]. To input L2, press [2ND] [L2].
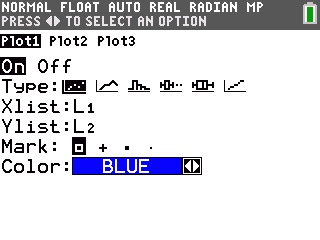
Please Note: On the statplot screen, you also have the option to change the color of the plot by highlighting the color and arrowing right or left until the desired color appears on the screen.
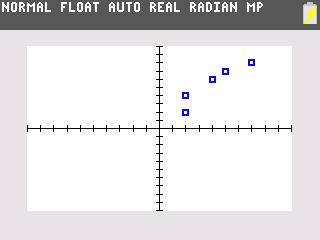
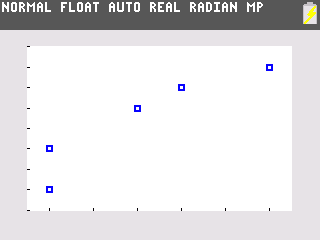
6) Press [GRAPH] to display the scatter plot. To get a better view of the graph, press [ZOOM] [9] to perform a ZoomStat.
Please see the TI-84 Plus C Silver Edition guidebook for additional information.