Solution 14243: Drawing a Pictograph On The TI-73 Explorer™.
How do I draw a pictograph on my TI-73 Explorer?
The TI-73 Explorer can display no more than seven pictograph icons for up to seven categories on the screen. If the scale is not big enough (the Data List is broken up by more than seven icons) the calculator will display an INVALID DIM error. Please see the below example data for the pictograph:
Compare the distances in kilometers between Dallas, Texas and seven other cities in North America. Use a vertical pictograph to display the results.
Create a categorical list called City using the following. Make sure to surround the first list element with quotation marks. This list will be symbolized with a lowercase "c" next to the title of the list:
• Toronto
• Mexico City
• Los Angeles
• Washington
• Denver
• Kansas City
• Vancouver
Create a numerical list called Dist using the following data: {2215, 1775, 2180, 1927, 1397, 836, 3444}
• Turn off all the stat plots by pressing [2nd][PLOT]4 [ENTER]
• Display the STAT PLOTS menu by pressing [2nd][PLOT]
• Define as a Pictograph by pressing 1 [ENTER]
• Select the diagram representing a pictograph
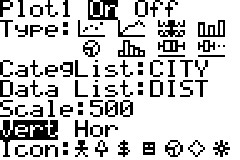
• Make sure the category and Data list are properly listed as City and Dist
• Set the scale at 500
• Select Vert for vertical
• Press [GRAPH] to display the stat plots

Please see the TI-73 Explorer guidebook for additional information.