Education Technology

Statistics and Probability / Comparing Distributions

Grade Level 6
Activity 11 of 24
In this lesson, students extend their previous work on describing a single data distribution to comparing several distributions collected from different populations with respect to the same attribute.

Planning and Resources

Objectives
Students use statistical calculations of center and spread to compare different distributions. They identify the advantages and disadvantages of using different graphical representations to compare distributions of the same measurement collected from different populations.

Vocabulary
symmetric
skewed
mound shaped
bimodal
mean
median
outlier
interquartile range (IQR) 
mean absolute deviation (MAD)


Standard: Search Standards Alignment

Downloads

Lesson Snapshot

Understanding

Measurements collected from the entire population are typically called a census, a complete count of everyone or everything in the population. A sample is a subset of the population, typically selected to represent the population.

What to look for

Students should note that bar graphs convey some information that can be used to compare distributions, but that they are limited as data analysis tools.

Sample Assessment

The plot shows the number of points earned in a contest by men and women.

Number of points earned:

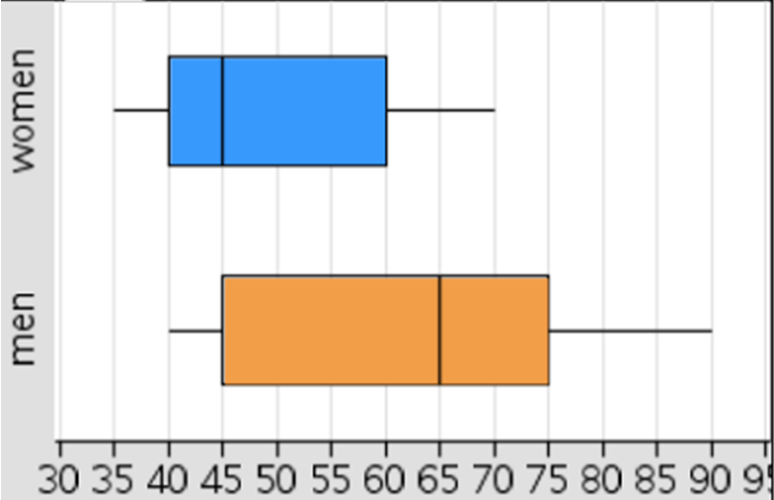
What is the least number of points earned in the contest by either men or women?

Answer: 35 points

The Big Idea

Graphs and summary statistics can be used to make comparisons among distributions of the same characteristic for different populations.

What are the students doing?

Students evaluate advantages and disadvantages of using dot plots, box plots, histograms and bar graphs in comparing data from countries to others with respect to a certain characteristic

What is the teacher doing?

Have students explain why the a bar graph does not the cannot be used to determine the mean, MAD, median, and IQR.