
Graphing Quadratic Functions
Math: Algebra I: Quadratic Functions
9-12
60 Minutes
TI-Nspire™ CX series
3.0
Lessons
TNS
Graphing Quadratic Functions
Activity Overview
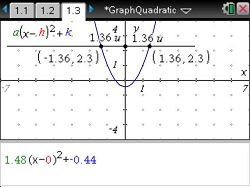
Students graph quadratic functions and study how the variables in the equations compare to the coordinates of the vertices and the axes of symmetry in the graphs.
Download Files
Teacher Files
Student Files
Math: Algebra I: Quadratic Functions
9-12
60 Minutes
TI-Nspire™ CX series
3.0
Lessons
TNS
iPad is a trademark of Apple Inc., registered in the U.S. and other countries.
Vernier EasyData,Vernier EasyLink and Vernier EasyTemp are registered trademarks of Vernier Science Education.
Vernier EasyData,Vernier EasyLink and Vernier EasyTemp are registered trademarks of Vernier Science Education.