
Is There a Limit?
Science: Biology: Cells
9-12
60 Minutes
TI-84 series
This is Activity 8 from the EXPLORATIONS Book: Biology with the TI-83 Plus.
Lessons
Is There a Limit?
Activity Overview
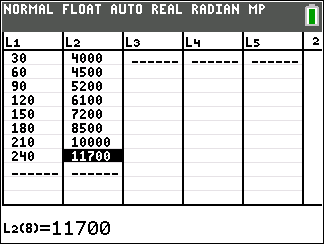
In this activity, students examine data about bacteria and their growth. They produce a scatter plot, a best-fit model, and draw conclusions based on the data and graph.
Download Files
Lesson Files
Science: Biology: Cells
9-12
60 Minutes
TI-84 series
This is Activity 8 from the EXPLORATIONS Book: Biology with the TI-83 Plus.
Lessons
iPad is a trademark of Apple Inc., registered in the U.S. and other countries.
Vernier EasyData,Vernier EasyLink and Vernier EasyTemp are registered trademarks of Vernier Science Education.
Vernier EasyData,Vernier EasyLink and Vernier EasyTemp are registered trademarks of Vernier Science Education.