
Ride the Rollercoaster
Math: Precalculus: Polynomial, Power, and Rational Functions
Math: AP Precalculus: Polynomial and Rational Functions
9-12
45 Minutes
TI Connect™ CE
TI-84 series
Lessons
Ride the Rollercoaster
Activity Overview
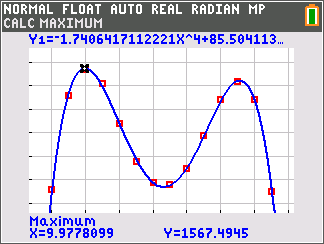
Students use polynomial regression to develop and assess the fit of equations modeling data. The equation models are then evaluated for reasonableness in their use for extrapolating beyond the given data sets.
Download Files
Teacher Files
Math: Precalculus: Polynomial, Power, and Rational Functions
Math: AP Precalculus: Polynomial and Rational Functions
9-12
45 Minutes
TI Connect™ CE
TI-84 series
Lessons
iPad is a trademark of Apple Inc., registered in the U.S. and other countries.
Vernier EasyData,Vernier EasyLink and Vernier EasyTemp are registered trademarks of Vernier Science Education.
Vernier EasyData,Vernier EasyLink and Vernier EasyTemp are registered trademarks of Vernier Science Education.