
Verbal to Visual: Sketching Graphs
Math: Middle Grades Math: Functions
Math: Algebra I: Functions and Relations
6-8
9-12
9-12
45 Minutes
TI-Nspire™ CX series
TI-Nspire™ CX CAS/CX II CAS
TI-Nspire™ Apps for iPad®
4.5
Lessons
TNS
Verbal to Visual: Sketching Graphs
Activity Overview
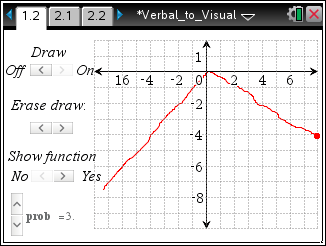
This lesson involves sketching graphs based upon important features described verbally in a situation.
Objectives
- Students will sketch a graph that exhibits the qualitative features of a function that has been described verbally.
- Students will describe qualitatively the functional relationship between two quantities by analyzing a graph (e.g., where the function is increasing or decreasing, linear or nonlinear).
- Students will model mathematics.
- Students will attend to precision.
Vocabulary
- function
- increasing/decreasing function
- constant rate of change
- quadrants
About the Lesson
This lesson involves sketching graphs based upon important features described verbally in a situation.
As a result, students will:
- Focus on identifying important features that aid in drawing sketches of functions, such as:
- where the function is increasing, decreasing, or remaining constant;
- the slope of the function or parts of the function, and;
- the quadrants the function lies in.
- Use these same ideas to describe the functional relationship between two variables as they write their own situation for a partner student to analyze.
Download Files
Math: Middle Grades Math: Functions
Math: Algebra I: Functions and Relations
6-8
9-12
9-12
45 Minutes
TI-Nspire™ CX series
TI-Nspire™ CX CAS/CX II CAS
TI-Nspire™ Apps for iPad®
4.5
Lessons
TNS
iPad is a trademark of Apple Inc., registered in the U.S. and other countries.
Vernier EasyData,Vernier EasyLink and Vernier EasyTemp are registered trademarks of Vernier Science Education.
Vernier EasyData,Vernier EasyLink and Vernier EasyTemp are registered trademarks of Vernier Science Education.