Knowledge Base
Solution 34212: Calculating Cubic Regressions on the TI-Nspire™ Family Handhelds.
How do I calculate a cubic regression on a TI-Nspire Family handheld?
Cubic Regression is a process by which the cubic (third degree) equation of "best fit" is found for a set of data.The following example will demonstrate how to calculate a cubic regression:
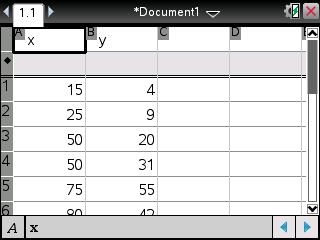
X= {15, 25, 50, 50, 75, 80, 95}
Y= {4, 9, 20, 31, 55, 42, 73}
Key in the data into the handheld:
• Press [home] and select List & Spreadsheet and press [enter].
• Input the data in Column A and Column B lists, pressing [enter] after each entry.
• Press the up arrow until you highlight Column A.
• Input [x] to name Column A
• Press the right arrow until you highlight Column B.
• Input [y] to name Column B
• Press [tab] once to get to an empty cell.
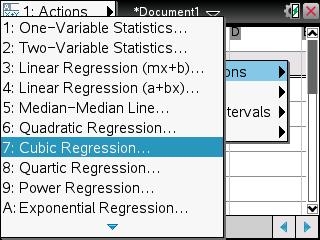
• Press [menu]
• Press 4: Statistics
• Press 1: Stat: Calculations
• Press 7: Cubic Regression
• Press the right arrow until you highlight 'x and press [tab].
• Press the right arrow again to highlight 'y and press [tab] to save the equation into [f1].
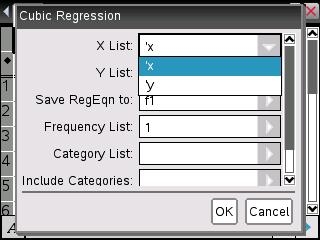
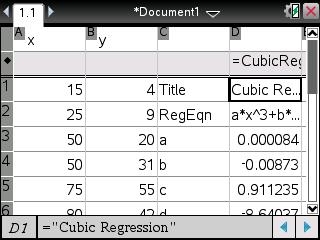
• Press [enter] to get the result of Cubic Regression
To graph the regression:
• Press [home]
• Select Graphs
• Press [enter] to see the graph or you can use Window/zoom and Zoom-Data to change the graph view.
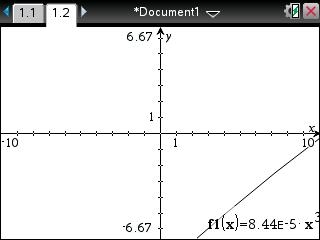
Note: If you do not see f1(x)=, press the up arrow until you see f1(x)= with the equation to be graph.
Please see the TI-Nspire family guidebooks for additional information.