Knowledge Base
Solution 30951: Calculating and Graphing a Median-Median Regression on the TI-Nspire™ Family and TI-Nspire Computer Software.
How do I calculate and graph a Median-Median Regression on the TI-Nspire Family and TI-Nspire Computer Software?
Med-Med (median-median) fits the model equation y=ax+b to be data using the median-median line (resistant line) technique, calculating the summary points x1,y1,x2,y2,x3 and y3. Med-Med displays values for a (Slope) and b (y-intercept).The following example will demonstrate how to calculate a Med-Med regression:
X= {15; 25; 50; 50; 75; 80; 95}
Y= {4; 9; 20; 31; 55; 42; 73}
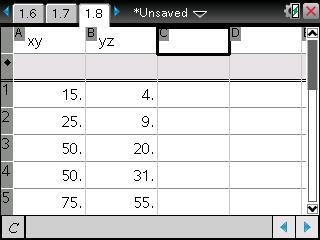
Key in the data into the handheld:
• Press [home] and select List & Spreadsheet and press [enter].
• Enter the data in L1 and L2 lists, pressing [ENTER] after each entry.
• Press the up arrow until you highlight L1.
• Input [x] [y] to name L1.
• Press the right arrow until you highlight L2.
• Input [y] [z] to name L2.
• Press [tab] once to get to the empty cell.
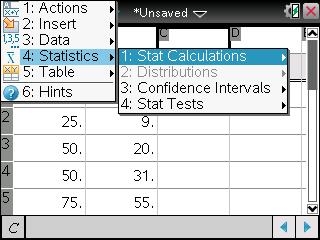
• Press [menu]
• Press 4: Statistics
• Press 1: Sta: Calculations
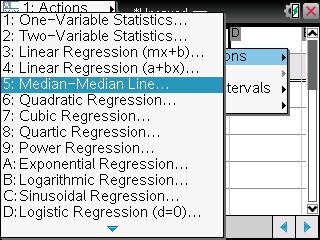
• Press 5: Median-Median Line
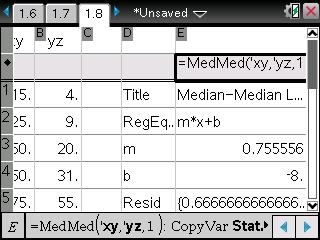
• Press the right arrow until you highlight 'xy and press [tab].
• Press the right arrow again to highlight 'yz and press [tab] to save the equation into [f1].
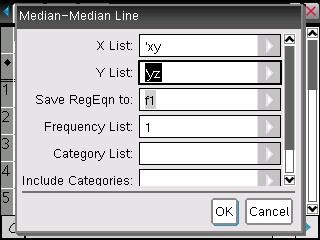
• Press [enter] to get the result of Med-Median Line
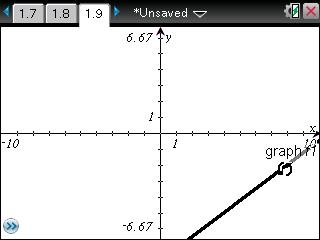
To graph the regression:
• Press [home]
• Select Graphs
Note: If you do not see f1(x)=, press the up arrow until you see f1(x)= with the equation to be graph.
• Press [enter] to see the graph or you can use Window/zoom and Zoom-Data to change the graph view.

Please see the TI-Nspire family products guidebooks for additional information.