Knowledge Base
Solution 27310: Changing the Color of a Graphed Function Using the TI-Nspire™ Family Products.
How do I change the color of a graphed function using the TI-Nspire family products?
A new feature of the TI-Nspire CX and TI-Nspire CX CAS handhelds and the TI-Nspire family computer software is the ability to change the color of a graphed function. To change the color of a graphed function using the TI-Nspire family computer software, follow the steps below.
To change the color of graphs or areas using the TI-Nspire CX and TI-Nspire CX CAS family software:
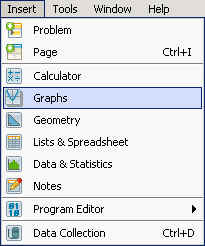
1) Click on the "Insert" menu and choose the "Graphs" application.
2) For f1(x), input x^2 and press [Enter] to graph the function.

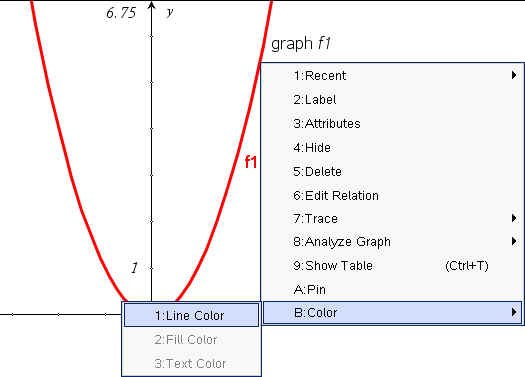
3) Right-click on the graph of the function and select "B:Color".
4) From the Color menu, select "1:Line Color".
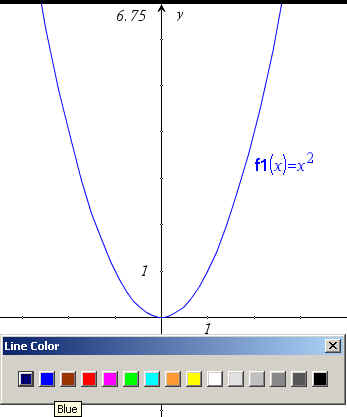
5) Left-click on the desired color to change the color of the graphed function.
To change the color of graphs or areas using the TI-Nspire CX and TI-Nspire CX CAS handhelds, follow the steps below:
Please Note: The following steps will NOT work with non TI-Nspire CX handhelds.
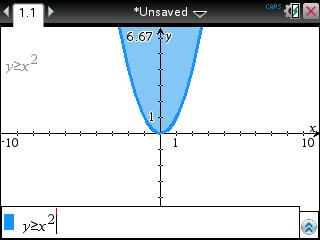
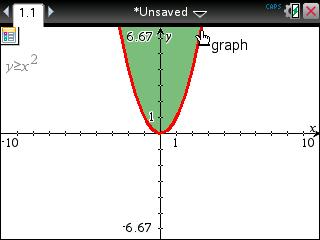
1) Create the equation or inquality you want to graph.
2) Press [menu].
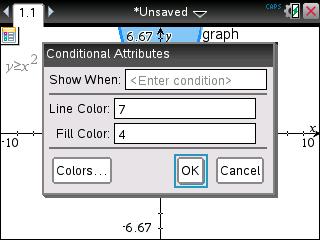
3) Press 1: Actions, 5: Set Conditions.
4) Click on the equation you want to change the color of.
5) To change the color of the line, enter in "Line Color" the number corresponding to the color you want.
6) To change the color of an inequality area, enter in "Fill Color" the number corresponding to the color you want.
Please Note: To see the color that corresponds with the number, scroll/tab to Colors and press [enter].
Please see the TI-Nspire CX, TI-Nspire CX CAS, TI-Nspire and TI-Nspire CAS guidebooks for additional information.