Knowledge Base
Solution 27110: Graphing a Sequence Function Using the TI-Nspire™ Family Products.
How do I graph a sequence function using the TI-Nspire handheld and computer software?
To graph a sequence function using the TI-Nspire family handheld and computer software, follow the example and steps below.
Example: Graph a sequence function for the following sequence of numbers: {1,5,9,13,...}
• Press [home] [1] to create a new document.
NOTE: If a previous document is already open, the handheld will display Do you want to save 'Unsaved Document'?. If the user chooses to save the document, the handheld will prompt for a name for the document and the location where the document is to be saved. Once this information is entered, a new document will be created. If the user chooses not to save the document, a new document will be created.
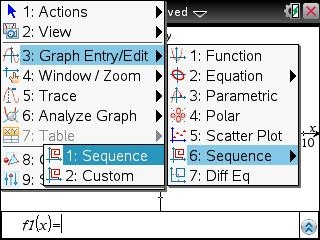
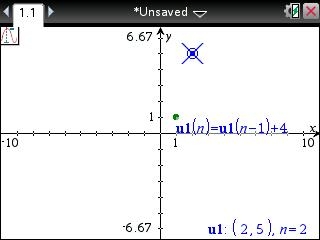
• Press the [2] key to insert the "Graphs" application. Press [menu] [3] [6] [1] to change the "Graph Type" to "Sequence".
• For u1(n)=, input u1(n-1)+4.
• For Initial Terms:=, input 1.
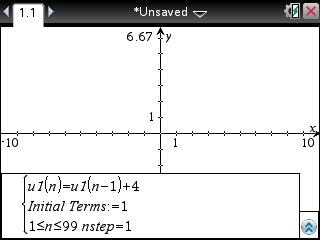
• Press [enter] to graph the sequence function.
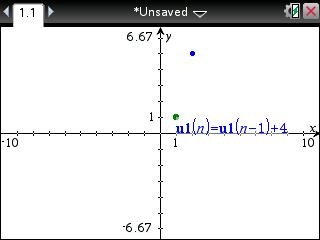
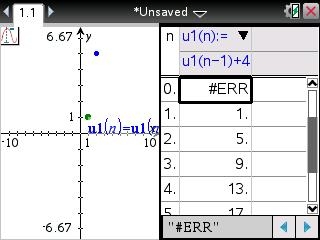
Note: To view the values for the sequence function, the user can either trace the graph or create a function table.
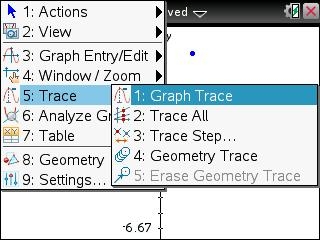
• To trace the sequence function, press [menu] [5] [1] to select the "Graph Trace" option. Using the right and left arrow keys, the user can now scroll up and down the graph to view the sequence values.
• To view the values for the sequence function via a function table, press [ctrl] [T]. This will split the screen, displaying the graph on the left and the function table on the right. To disable the function table, press [ctrl] [tab] to make the Graphs application the active window, then press [ctrl] [T] again.
Please see the TI-Nspire family guidebooks for additional information.