Solution 24651: Graphing a Categorical List Using the TI-Nspire™ Family Handheld and Computer Software.
How can I graph a categorical list instead of a numerical list using the TI-Nspire family handheld and computer software
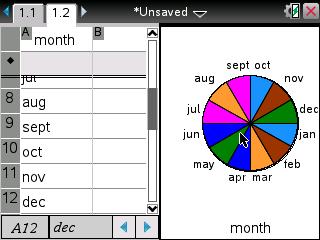
To graph a categorical list, follow the example below to graph the months of the year.
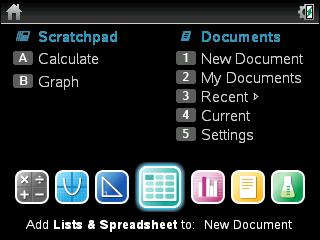
• Press [home] and choose to add a Lists & Spreadsheet application.This will be the third option from the icons listed at the bottom.
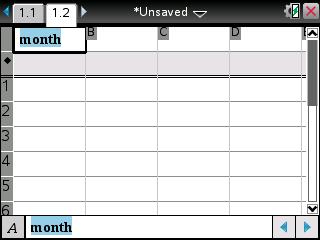
• Scroll to the very top of column A.
• Press [M] [O] [N] [T] [H] [enter].
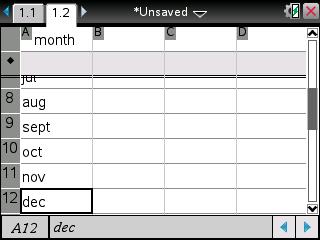
• Scroll down to cell A1.
• Press [J] [A] [N] [enter].
• Repeat the previous step for the remaining months of the year.
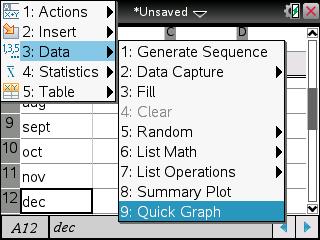
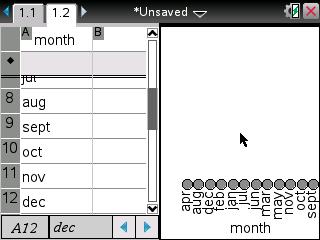
• Press [menu] [3] [9].
• The handheld will display a split-screen with the categorical data on the left and the Quick Graph application on the right, along with the data graphed as a dot chart.
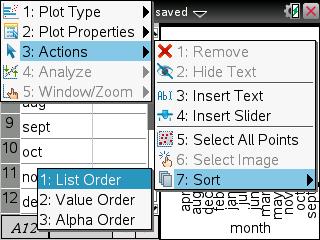
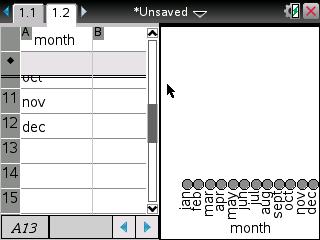
• Press [menu] [3] [7] [1].
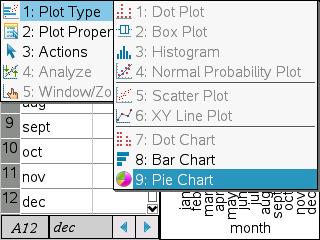
• Press [menu] [1] [9].
Please see the TI-Nspire family handheld and software guidebooks for additional information.
TI websites use cookies to optimize site functionality and improve your experience. To find out more or to change your preferences, see our cookie policy page. Click Agree and Proceed to accept cookies and enter the site.
Control your cookie preferences
You can control your preferences for how we use cookies to collect and use information while you're on TI websites by adjusting the status of these categories.
Category
Description
Allow
Analytics and performance cookies
These cookies, including cookies from Google Analytics, allow us to recognize and count the number of visitors on TI sites and see how visitors navigate our sites. This helps us improve the way TI sites work (for example, by making it easier for you to find information on the site).
Advertising and marketing cookies
These cookies enable interest-based advertising on TI sites and third-party websites using information you make available to us when you interact with our sites. Interest-based ads are displayed to you based on cookies linked to your online activities, such as viewing products on our sites. We may also share this information with third parties for these purposes. These cookies help us tailor advertisements to better match your interests, manage the frequency with which you see an advertisement, and understand the effectiveness of our advertising.
Functional cookies
These cookies help identify who you are and store your activity and account information in order to deliver enhanced functionality, including a more personalized and relevant experience on our sites. If you do not allow these cookies, some or all site features and services may not function properly.
If you do not allow these cookies, some or all of the site features and services may not function properly.
Social media cookies
These cookies allow identification of users and content connected to online social media, such as Facebook, Twitter and other social media platforms, and help TI improve its social media outreach.
Strictly necessary
These cookies are necessary for the operation of TI sites or to fulfill your requests (for example, to track what items you have placed into your cart on the TI.com, to access secure areas of the TI site, or to manage your configured cookie preferences).