Knowledge Base
Solution 34917: Calculating and Graphing Quadratic Regressions Using the TI-84 Plus C Silver Edition.
How do I calculate and graph a quadratic regression using the TI-84 C Silver Edition?
The example below will demonstrate how to calculate and graph a quadratic regression using the TI-84 Plus C Silver Edition.
Data for this example: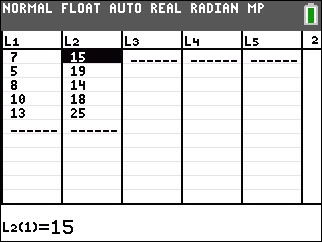
To enter the data:
1) Press [STAT] [1] to access the STAT list editor.
2) Input the data in the L1 and L2 lists, pressing [ENTER] after each number.
3) Press [2ND] [QUIT] to quit and return to the home screen.
To calculate the quadratic regression (ax2+bx+c):
1) Press [STAT] to access the STAT menu.
2) Scroll right to highlight the CALC menu.
3) Press [5] to select QuadReg.
4) Press [2ND] [L1] [,] [2nd] [L2] to input L1, L2. L1 and L2 may already be populated by default.
5) Scroll down to Store RegEQ and press [VARS], scroll right to highlight Y-VARS, then press [1](function) and [1] to input ,Y1.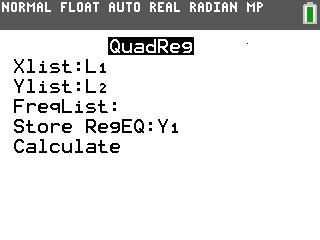
6) Press [ENTER] to calculate the quadratic regression. This will also copy the quadratic regression equation to the Y= Editor.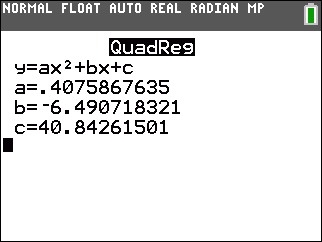
To graph the data and the quadratic regression equation:
1) Press [2ND] [STAT PLOT] [1] to access the STAT PLOTS menu and edit Plot1.
2) Press [ENTER] to turn On Plot1.
3) Scroll down to Type: and press [ENTER] to select the scatter plot option.
4) Scroll down to Xlist and press [2ND] [L1] to input L1. Scroll down to Ylist and press [2ND] [L2] to input L2. L1 and L2 may already be populated by default.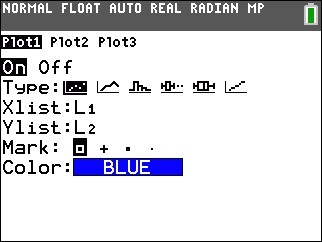
5) Press [GRAPH] to graph the data and the quadratic regression equation.
6) If the graphs are not displayed, press [ZOOM][9] to perform a ZoomStat.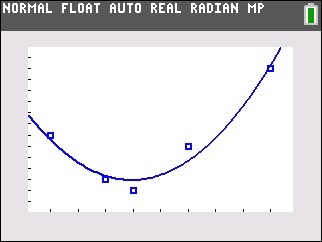
Please see the TI-84 Plus C Silver Edition guidebook for additional information.