Solution 34424: Coefficient (r-Values) are not Displayed When Calculating Statistical Regressions on the TI-83 Plus and TI-84 Plus Family of Graphing Calculators.
Why are the r-values not automatically displayed when I calculate a statistical regression on the TI-83 Plus and TI-84 Plus family of graphing calculators?
When using the TI-83 Plus and TI-84 Plus family of graphing calculators, the r and r2 values are computed for LinReg(a+bx), LinReg(ax+b), ExpReg, PwrReg and LnReg.R2 is computed for QuadReg, CubicReg and QuartReg.
The r, r2 and R2 values are not computed for Logistic, SinReg and Manual-Fit.
All the r-value variables can be found by pressing [VARS] [5], scrolling over to "EQ" and scrolling down to options 7, 8 and 9.
The r-values are not automatically displayed with the regression models. The handheld has the option to choose if the results for r, r2 or R2 will be displayed when the regression is calculated. The default is to not display the diagnostics (r, r2 or R2), but the CATALOG menu has an option called "DiagnosticOn" that will allow these variables to be displayed. Once the DiagnosticOn command is executed, the next time the regression model is calculated, the diagnostics will be displayed. The diagnostics will continue to be displayed with the regression models until "DiagnosticOff" is executed or the handheld is reset.
To turn the DiagnosticOn:
1) Press [2ND] [0] [x-1] to access the CATALOG and jump to the "D" section of the commands.
2) Press the [Down Arrow] until you reach DiagnosticOn.
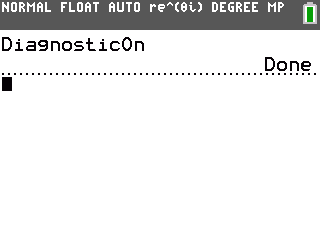
3) Press [ENTER] twice.
The screen will show "DiagnosticOn" and "Done".
Compute a regression, for example LinReg(a+bx), and the values for r and r2 will now be displayed.
Please see the TI-83 Plus and TI-84 Plus Family guidebooks for additional information.