Solution 34922: Graphing a Line Using Two Points on the TI-83 Plus and TI-84 Plus Family of Graphing Calculators.
How do I graph a line using two points on the TI-83 Plus and TI-84 Plus family of graphing calculators?
The following example will demonstrate how to graph a line using two points.
For Example: Graph a line connecting the points (3,7) and (5,8).
Data for this example:
L1: {3,5}
L2: {7,8}
1) Press [STAT] [ENTER] to access the STAT list editor.
2) Input the values 3 and 5 under the L1 list remembering to press [ENTER] after each value.
3) Input the values 7 and 8 under the L2 list.
4) Press [2nd] [MODE] to QUIT and return to the home screen.
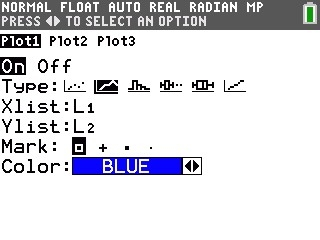
5) Press [2nd] [Y=] to access the STAT PLOT setup menu.
6) Press [ENTER] to select Plot1 for edit.
7) Turn the plot on by pressing [ENTER] when "On" is highlighted.
8) Scroll down to "Type:", highlight the second option on the first row and press [ENTER]. This will setup the stat plot to graph an x-y line.
9) Scroll down to "Xlist:" and press [2nd] [1] to input L1.
10) Scroll down to "Ylist:" and press [2nd] [2] to input L2.
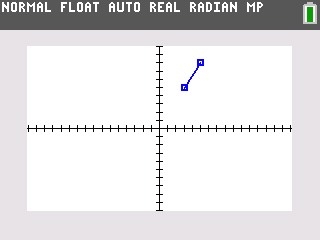
11) Press [GRAPH] to graph a line connecting the two points.
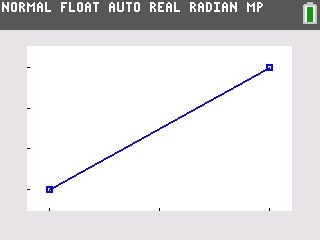
12) To get a better view of the graph, press [ZOOM] [9] to select the ZoomStat function.
Please see the TI-83 Plus and TI-84 Plus Family guidebooks for additional information.