Solution 34921: Graphing a Vector on the TI-83 Plus and TI-84 Plus Family of Graphing Calculators.
How do I graph a vector on the TI-83 Plus and TI-84 Plus family of graphing calculators?
The TI-83 Plus and TI-84 Plus family of graphing calculators do not have a vector graphing mode. However, users can still graph a vector using a STAT PLOT. To do this, follow the example below:
Example: Graph a vector that has a magnitude of 5 units with the direction 30 degrees.
To convert the vector to rectangular coordinates:
1) Press [MODE] and make sure that the DEGREE mode is selected. If DEGREE is not selected, scroll down and over to DEGREE and press [ENTER], then press [2nd] [MODE] to return to the home screen.
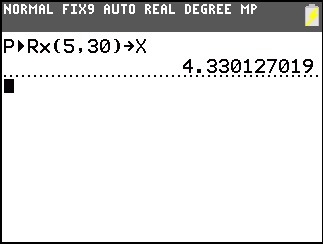
2) Press [2nd] [APPS] [7] to access the ANGLE menu and paste the P>Rx( function onto the home screen.
3) Press [5] [,] [3] [0] [ ) ].
4) Press [STO>] [X,T,theta,n] [ENTER] (the Rx value is now stored to the variable X).
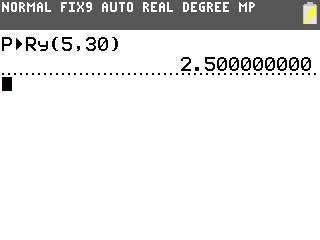
5) Press [2nd] [APPS] [8] to access the ANGLE menu and paste the P>Ry( function onto the home screen.
6) Press [5] [,] [3] [0] [ ) ].
7) Press [STO>] [ALPHA] [1] [ENTER] (the Ry value is now stored to the variable Y).
Input list values:
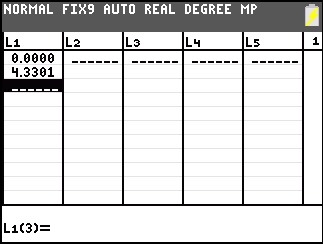
1) Press [STAT] [ENTER] to access the STAT List Editor.
2) With the cursor under the L1 list, press [0] [ENTER] [X,T,theta,n] [ENTER].
3) Scroll over to the L2 list and press [0] [ENTER] [ALPHA] [1] [ENTER].
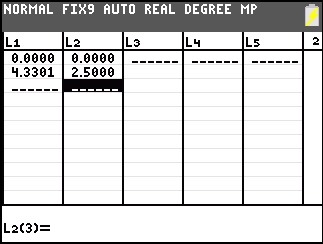
4) Press [2nd] [MODE] to exit the STAT List Editor.
Graph the vector:
1) Press [2nd] [Y=] [ENTER] to access the STAT PLOT Editor.
2) With the ON option highlighted, press [ENTER] to turn on Plot1.
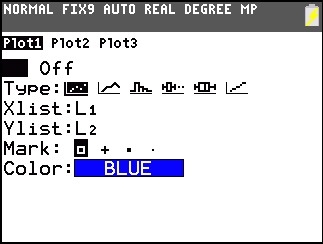
3) For Type:, select the second option which is an X-Y Line graph.
4) For the Xlist option, input L1. If L1 is not already displayed, press [2nd] [1] to input L1.
5) For the Ylist option, input L2. If L2 is not already displayed, press [2nd] [2] to input L2.
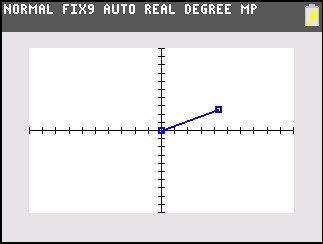
6) Press [GRAPH] to graph the vector.
Please see the TI-83 Plus and TI-84 Plus Family guidebooks for additional information.